Track 2: Self-Service Dashboard with Report
Dashboard is a new way of information delivery. You can create, edit, and browse dashboards from the Server Console using JDashboard. With prebuilt library components, you can freely choose the objects you want to display in a dashboard, without having to know how these objects were created, what data sources to use, what styles to set, and so on. A dashboard can hold multiple library components so that when browsing the dashboard, you are able to see multiple data aspects. Within a dashboard, library components are able to communicate with each other via the message mechanism. This enables actions such as common filters to be applied to all the components of a dashboard even when coming from different data sources to achieve data synchronization. Furthermore, you can run reports and Visual Analysis templates directly by invoking Web Report Studio/Page Report Studio and Visual Analysis inside JDashboard without having to switch to the Server Console, which enables analyzing with different tools in just one JDashboard window.
This track contains the following tasks:
- Task 1: Create a Dashboard and Insert Library Components
- Task 2: Insert a KPI
- Task 3: Insert a Report Component
- Task 4: Synchronize the Components
- Task 5: Use a Slider to Filter on Quantity
- Task 6: Insert a Third-Party Gadget (Stock Widget)
- Task 7: Export the Library Components
- Task 8: Use the Configuration Panel to Change Parameter Values
- Task 9: Share Parameters Among Components
- Task 10: Run a Report in JDashboard
- Task 11: Set a Dashboard as the Server Home Page
![]() To perform this track, you should have a JDashboard license for Server. In the meantime, JDashboard is in maintenance mode, and we will not be adding new features to it. If you need more information, contact Customer Service.
To perform this track, you should have a JDashboard license for Server. In the meantime, JDashboard is in maintenance mode, and we will not be adding new features to it. If you need more information, contact Customer Service.
Task 1: Create a Dashboard and Insert Library Components
- In the Start Page of the Server Console, select Dashboard in the Create category. Server creates a blank dashboard in JDashboard in a new window tab.
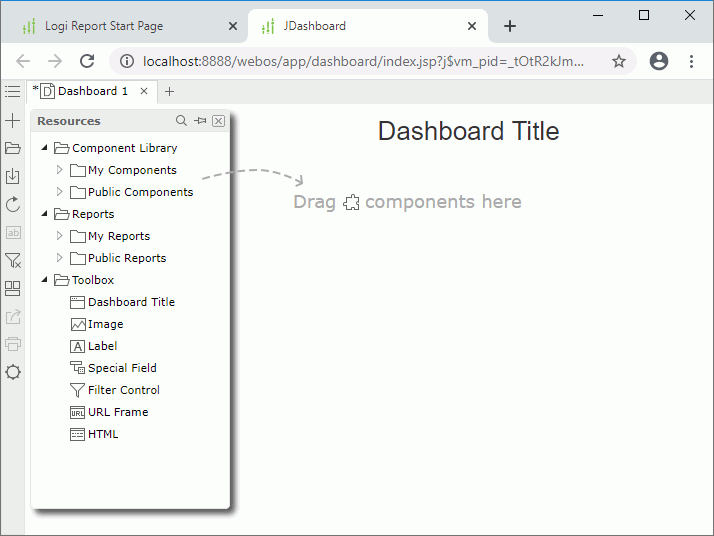
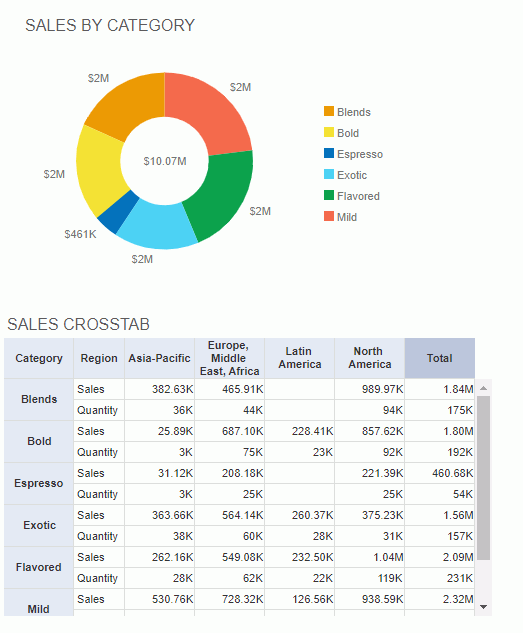
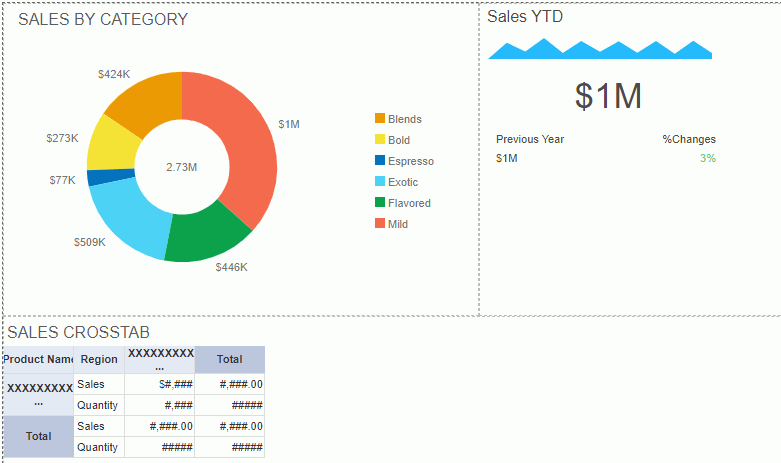
- In the Resources panel, expand the Component Library > Public Components > SampleReports folder. Drag Sales by Category.lc and Crosstab.lc to the dashboard body as follows:
- Select Save
 on the toolbar.
 - In the Save As dialog box, replace Dashboard 1 with Products in the File Name text box, then select OK to save the dashboard into the My Reports folder in the server resource tree.
Task 2: Insert a KPI
KPIs (Key Performance Indicators) help in business performance management. They are based on predefined functions and can be further enriched with trend charts. You can create KPIs in Designer or Web Report Studio and use them for deeper data insights in dashboards.
In this task, we insert a prebuilt KPI to the dashboard.
- From the Component Library > Public Components > SampleReports folder in the Resources panel, drag Sales YTD.lc to the dashboard body and place it on the right of the chart.
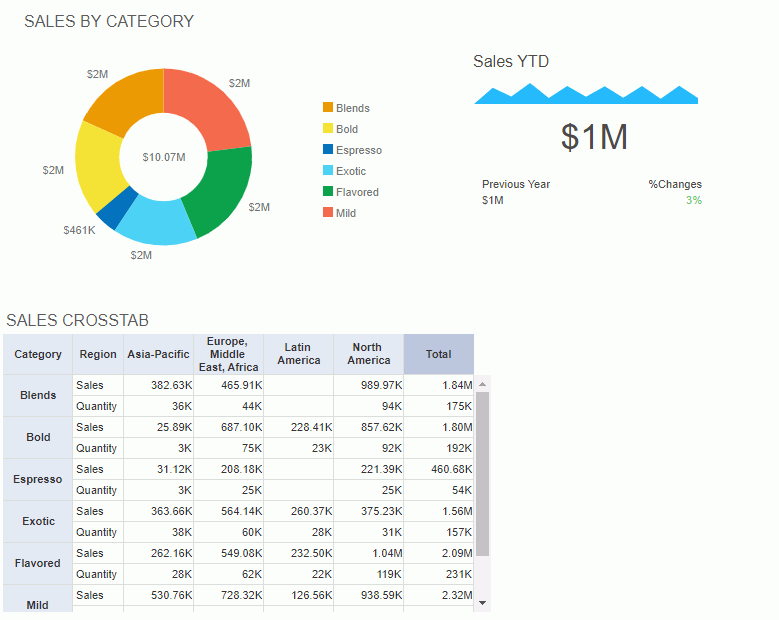
- Select Save
 to save the dashboard.
Task 3: Insert a Report Component
You can also insert report components that use business views in dashboards directly.
- In the Resources panel, go to the Reports > Public Reports > SampleReports folder, expand Shipment Status Report.wls and drag TableComp to the dashboard body below the crosstab.
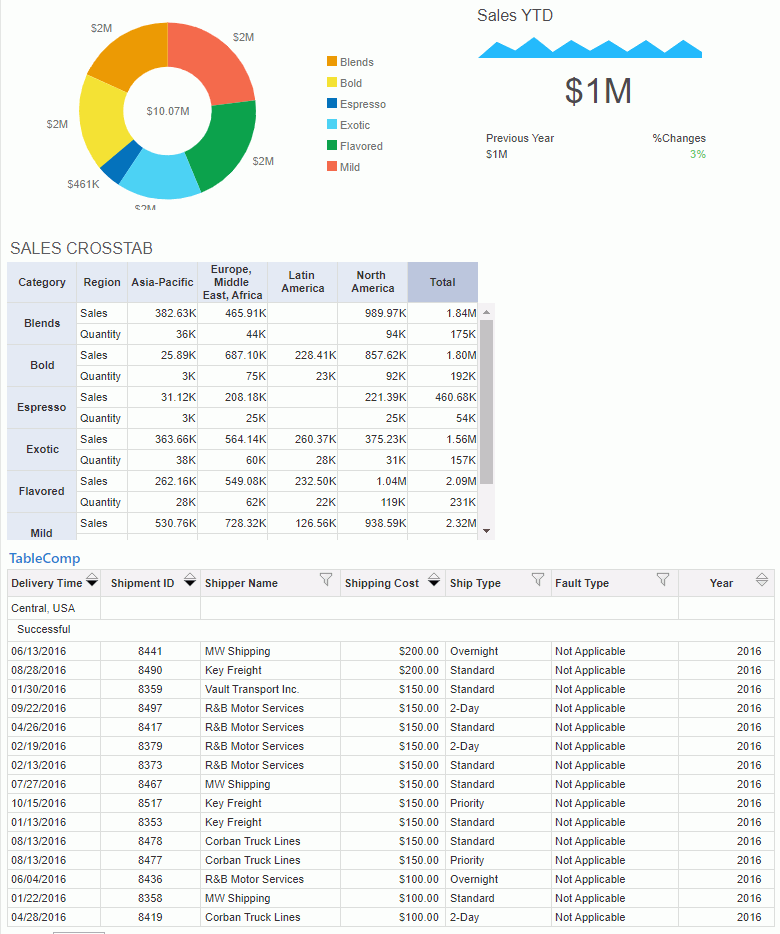
- Select Close
 on the top right of the Resources panel to close the panel.
 - Select Save
 on the toolbar to save the dashboard.
Task 4: Synchronize the Components
In this task, we want to select any value of the Category field in the crosstab to automatically update the chart. This is achieved by delivering a filter synchronization message between the two library components.
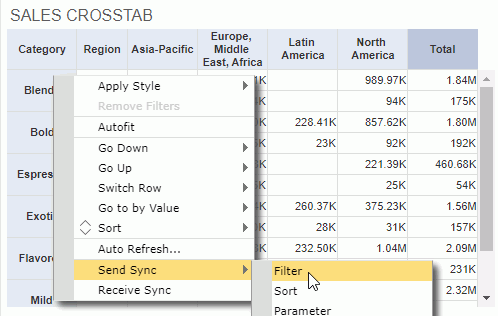
- Right-click on any Category value in the crosstab row header, Blends for example, and navigate to Send Sync > Filter on the shortcut menu.
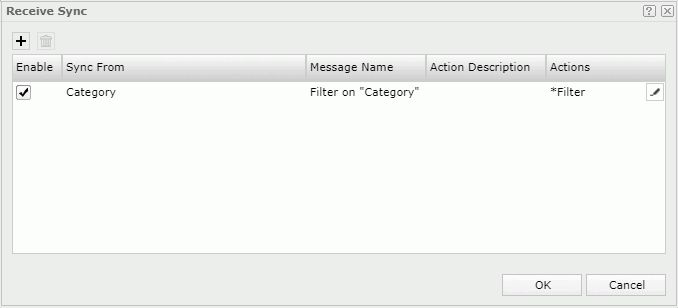
- The chart automatically receives the synchronization message because it uses the same business view as the crosstab and contains the field Category too. To view details of the message, right-click the chart and select Receive Sync. JDashboard displays the filter message in the Receive Sync dialog box. Close the dialog box.
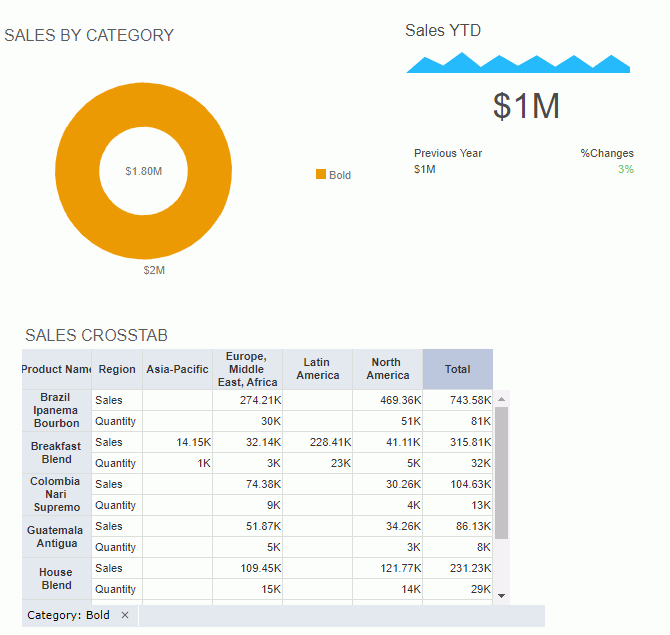
- Select any value in the crosstab row header, for example Bold. JDashboard filters the chart to show data of the Bold category only after it receives the synchronization message.
You may find that JDashboard filters the crosstab at the same time. This is because at report design time, the library component designer has predefined to make it receive a filter message too. You can right-click on the crosstab and select Receive Sync to view the details if you want.
- We want to remove the filter from the chart. Select Clear Filters
 on the toolbar.
 - Select Save
 on the toolbar to save the dashboard.
Task 5: Use a Slider to Filter on Quantity
- Select Show Resources
 on the toolbar to display the Resources panel, then from the Toolbox node, drag Filter Control to the dashboard body on the right of the crosstab.
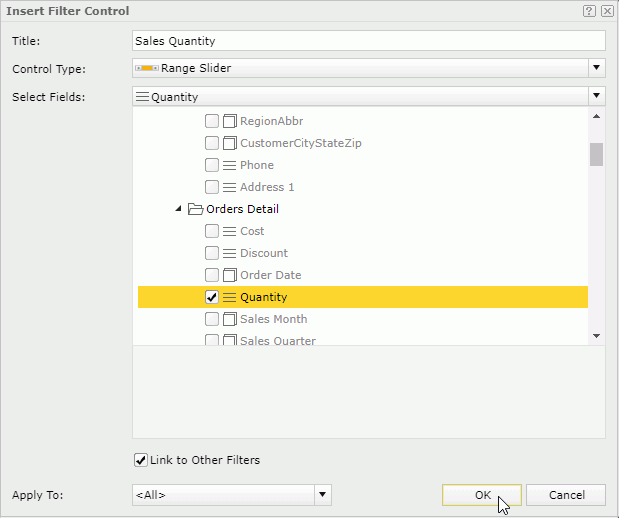
 - In the Insert Filter Control dialog box, type Sales Quantity in the Title text box and select Range Slider as the control type.
- Expand the Select Fields drop-down list. It contains the business views that the data components in the dashboard use. Here we only want to filter data components that use WorldWideSalesBV. Select Quantity in WorldWideSalesBV, then select OK to insert the slider.
- Close the Resources panel.
Next, we use the slider to show the data for Quantity between 2000 and 8000 only.
- Drag the left arrow to set a minimum range 1973 and the right arrow to set a maximum range 8031. JDashboard filters the chart and crosstab. The other components use different business views so JDashboard does not filter them.
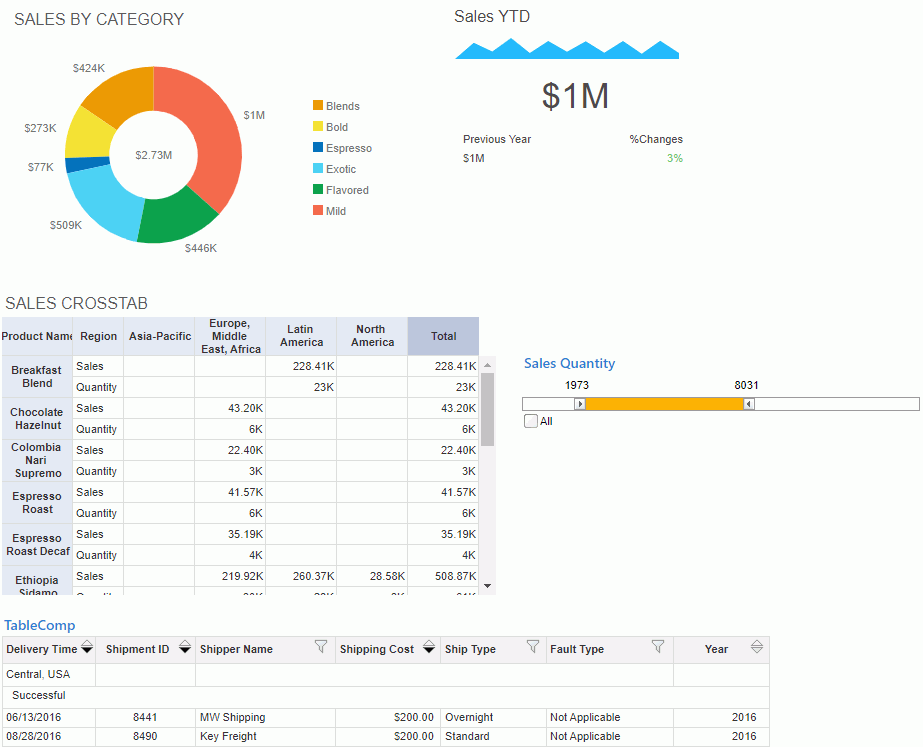
- Save the dashboard.
Task 6: Insert a Third-Party Gadget (Stock Widget)
- Select Show Resources
 on the toolbar to display the Resources panel, then drag URL Frame from the Toolbox node to the dashboard body beside the KPI. JDashboard displays the Insert URL Frame dialog box.
 - In the Title text box, type My Stocks, and in the URL text box, type http://edulifeline.com/includes/stocks_widget/.
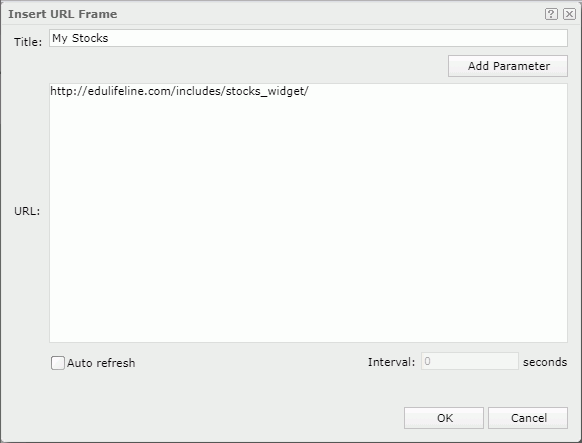
- Select OK to insert the specified web page into the dashboard.
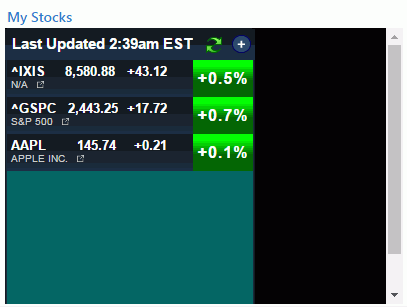
- Close the Resources panel and save the dashboard.
Task 7: Export the Library Components
- Select Export
 on the toolbar. JDashboard displays the Export dialog box.
 - Select Customize Layout from the Layout drop-down list.
By default, JDashboard arranges all the exportable library components using a tabular style according to their positions in the dashboard in the Design tab on the right. Each tabular cell can hold at most one component. Sliders and gadgets cannot be exported so they are not available here. Next, we change the layout of the components a little bit by moving the KPI closer to the left.
- Select in the tabular cell containing the chart to select the cell.
- Select Vertical Split
 on the toolbar to split the cell into two. JDashboard places the chart in the left cell.
 - Right-click anywhere in the cell containing the KPI, select Remove from the shortcut menu.
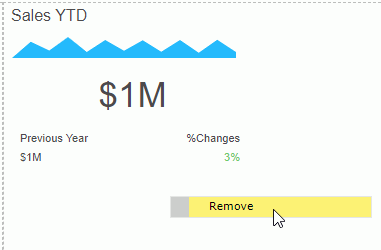
- Drag Sales YTD (the KPI) from the Resources box to the blank cell right to the chart and move it closer to the chart.
When exporting tables and crosstabs, by default JDashboard only exports the data currently displayed in the dashboard. In our dashboard, the table contains several pages and we can view only one page at a time, that is to say, we get only the currently displayed page in the exported result. However, we want to get the full data of the table in the exported result, so we need a further setting.
- Right-click in the cell holding the table and select Filter from the shortcut menu.
- In the Filter dialog box, select the All option and select OK.
- Select Export
 on the toolbar.
 - In the Export dialog box,
keep the default settings to export the dashboard to a PDF file.
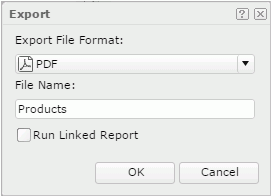
- Select OK. The exporting process begins. When it finishes, you can open the PDF file to view the result.
- Close the Export dialog box and save the dashboard.
Task 8: Use the Configuration Panel to Change Parameter Values
When a library component uses parameters and its configuration panel is enabled, you can use the configuration panel to change its parameter values.
- On the table, place the mouse anywhere on the title bar, then select Options
 that JDashboard displays on the title bar and select Edit Setting from the drop-down list to display the configuration panel.
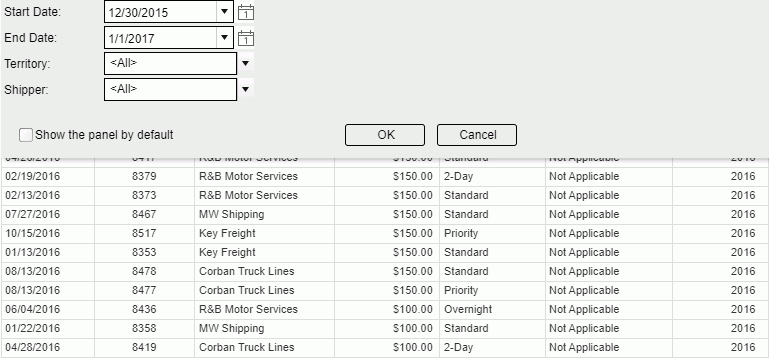
- Select in the value combo box of the Shipper parameter. JDashboard displays the Enter Values dialog box.
- Clear All Values, select UBS Uniform Logistics in the left box and select
 to add it to the right box, then select OK.
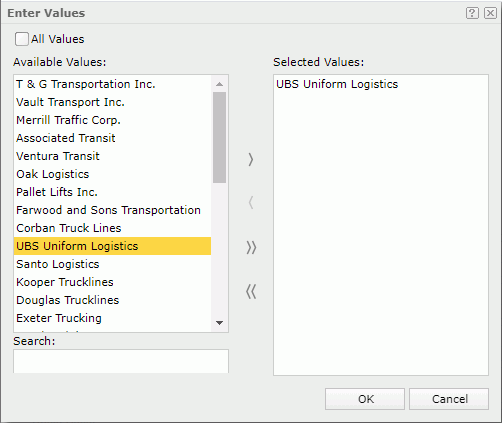
- Select OK in the configuration panel. The table now shows records of this shipper only.

- Save the dashboard.
Task 9: Share Parameters Among Components
When two or more library components in a dashboard contain parameters that meet the following cases, you can share the parameters among them. After sharing parameters, you just need to provide values to one group of the parameters and all related components are able to receive them.
-
The numbers of the parameters in each library component are the same.
-
According to the parameter order in each library component, the orders of the parameter data types are the same. For example, the parameter data types in a component are String, Number, and Boolean. If there is another component in which the parameter data types are also String, Number, and Boolean, the two components fulfill the condition of the same parameter data types.
-
It is up to users to make sure the to-be-shared parameters contain some common values.
In this task, we insert two library components having similar parameters and see the difference between before and after sharing the parameters.
- Select Add
 on the dashboard title bar to add a new dashboard. JDashboard creates a new tab and labels it Dashboard 2.
 - Expand Component Library > Public Components > SampleReports and drag Shipment Status Overview.lc and Shipments by Status.lc one by one to the dashboard body.
- Close the Resources panel.
- Select Options
 on the toolbar and select Share Parameter.
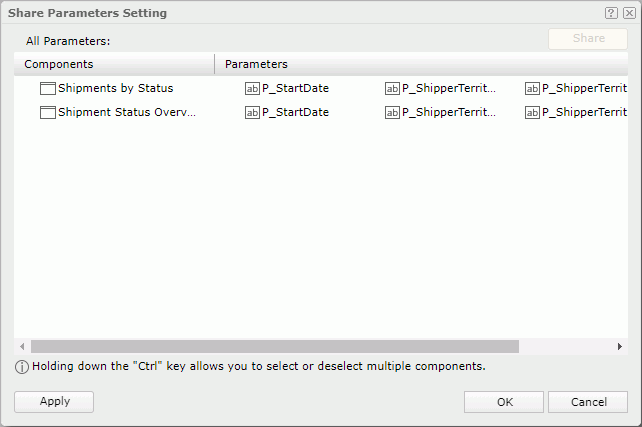
 - JDashboard displays the Share Parameters Setting dialog box, showing that the two library components have shared parameters. Close the dialog box.
- Select Enter Parameter Values
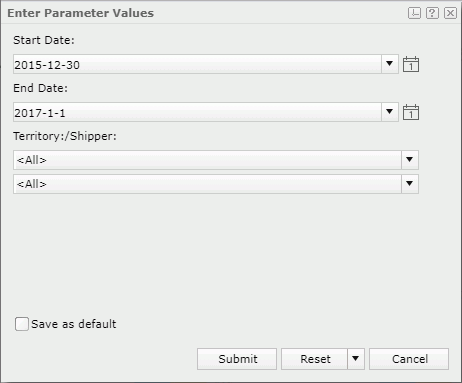
 on the toolbar. The Enter Parameter Values dialog box lists the following parameters. Close the dialog box.
Next we remove the parameter share between the two components to see how many parameters we need to specify.
- Select Options
 on the toolbar and select Share Parameter. JDashboard displays the Share Parameters Setting dialog box.
 - Select either component and select Cancel Share, then select OK.
- Select Enter Parameter Values
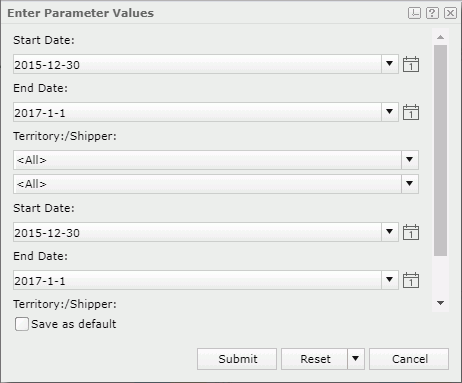
 on the toolbar to access the Enter Parameter Values dialog box again. Now it lists separate pairs of the Start Date, End Date, and Territory/Shipper parameters that the two library components apply. Close the dialog box.
- Select Save
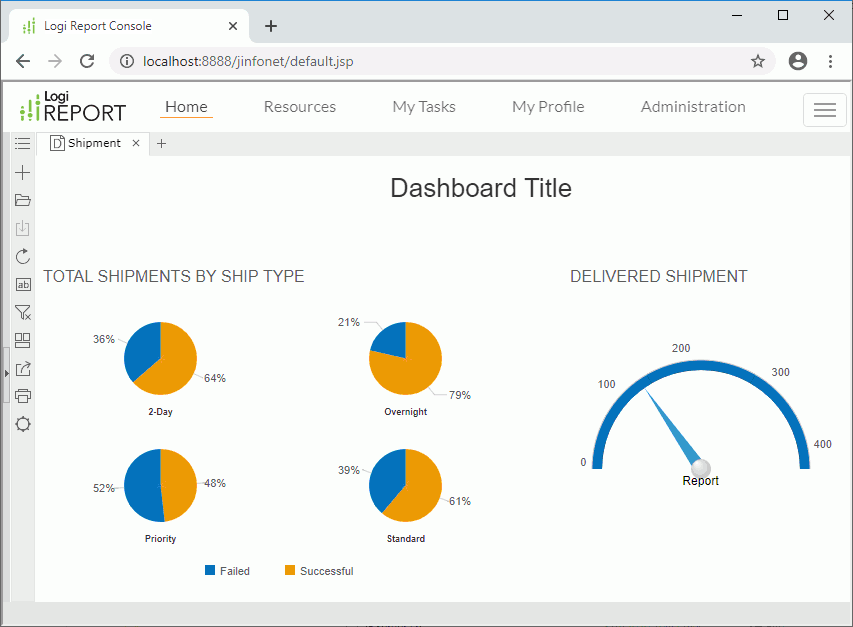
 on the toolbar to save the dashboard as Shipment.
Task 10: Run a Report in JDashboard
You can run a report in Web Report Studio or Page Report Studio within JDashboard. In this task, we run a web report inside JDashboard without going to the resource tree on the Server Console.
- Keep the Shipment dashboard active.
- From the Resources panel, drag Sales Detail Report.wls in the Reports > Public Reports > SampleReports folder to the dashboard body, then close the panel.
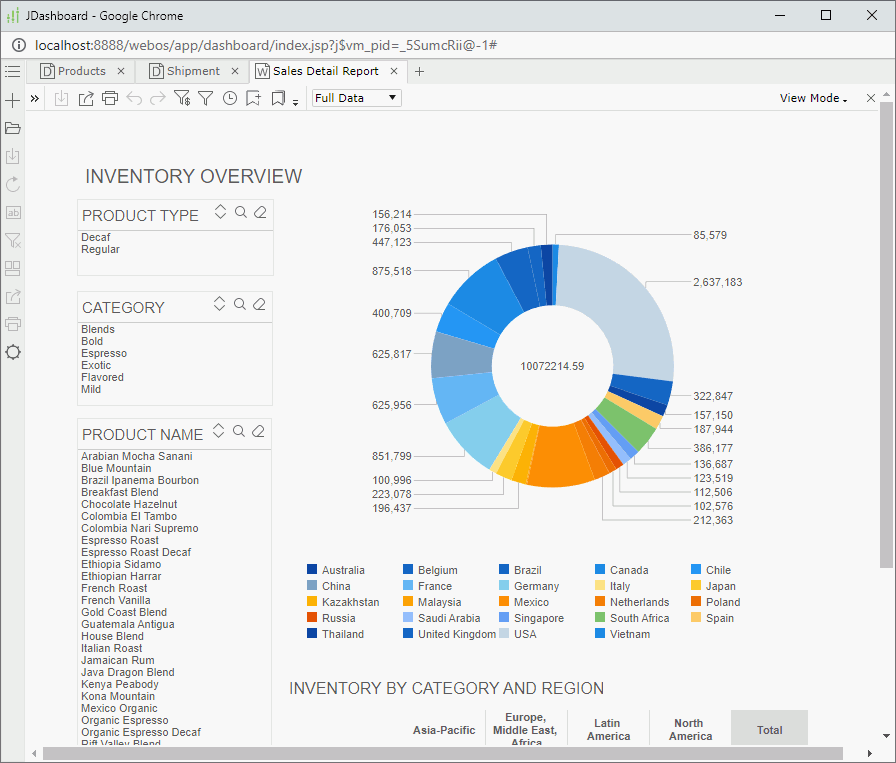
- JDashboard loads the report into a separate tab via Web Report Studio.
Task 11: Set a Dashboard as the Server Home Page
- In the web browser, change from the JDashboard tab to the Report Start Page tab.
- Select My Profile in the Manage category.
- In the My Profile > Customize Server Preferences > General tab, select Use a Dashboard for the Home Page option, then select OK.

- Select OK in the prompt message.
- Select Resources on the system toolbar, then go to the My Reports folder.
- Select Shipment.dsh in the folder and Server loads the dashboard into a new JDashboard window.
- Select Options
 on the toolbar and you can see Set as Server Home is enabled on the menu list. Select the option to set the Shipment dashboard as the Server home page.
 - Refresh the Server Console page. You can find that Server adds a Home label beside Resources on the system toolbar.
- Select Home and you can access the Shipment dashboard immediately.
 Previous Topic
 Back to top