

Geo Analysis
Report provides geographic visualization and analysis by overlaying customized areas and markers onto interactive maps in Google Maps, OpenStreetMap, and OpenCycleMap. Report supports three types of maps: Roadmap, Satellite, and Terrain. You can adjust conditional properties such as Shape, Size, Color, and Label to provide an understanding of the map data at a quick glance. Geo Analysis extends traditional data analysis on static maps, where zooming and panning are common, to more dynamic methods of interacting with geographic data. You can analyze data using a familiar map interface and drill down hierarchies containing countries, states, counties, and cities. Report supports Geo Analysis in Page Report Studio, Web Report Studio, and JDashboard.
For more information about creating geographic maps, see Using Geographic Maps in the Report Designer Guide.
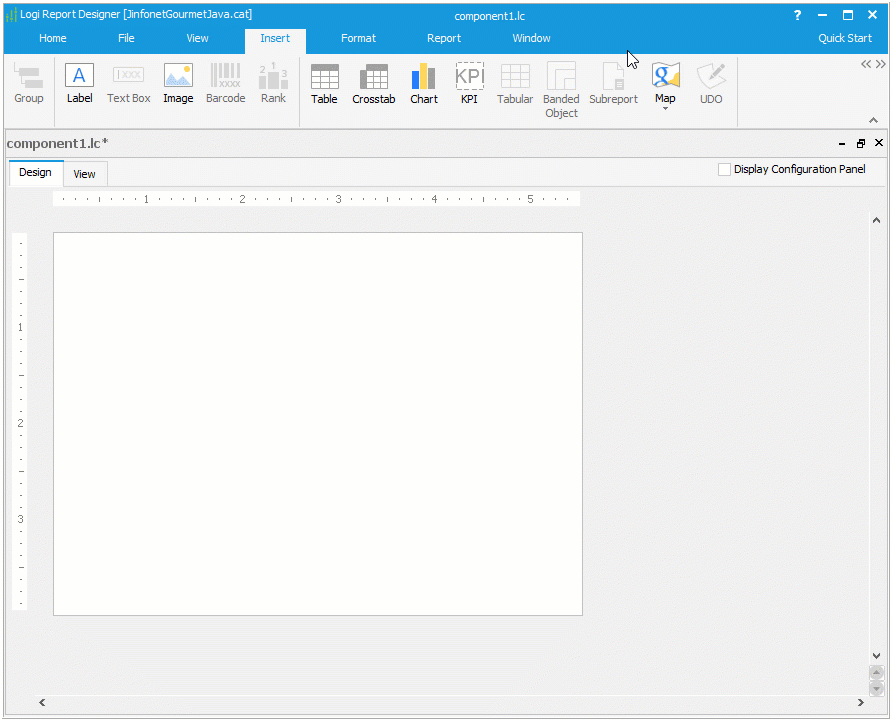
In the following example, we create a geographic map in a library component and use it to create a dashboard.
First we create the geographic map library component in Designer.
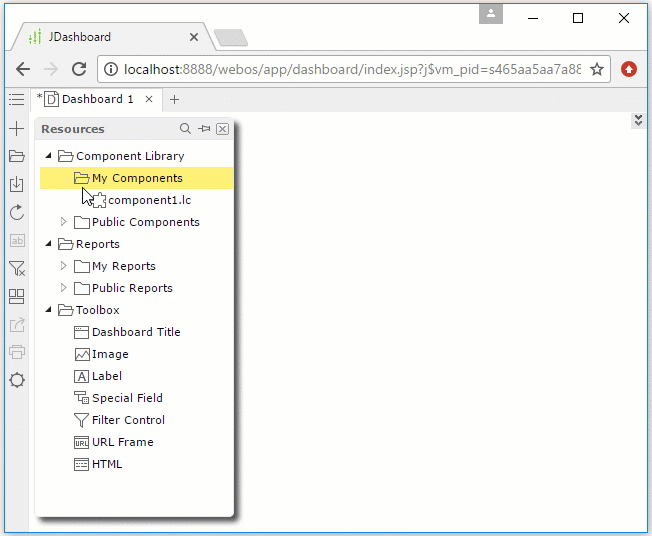
After the library component is published to Server, we can then add it to a dashboard to perform geo analysis on the map.
 Back to top