Data Types and Columns
Vizlib Writeback Table supports a range of data types and utility types you can use when you're adding and formatting columns.
This topic contains the following sections:
Data Types and Utility Types
-
Data types are used to add and edit data fields, helping you to display any data you need to add to the table (e.g. a text section for comments).
-
Utility types display data that is generated from other values in the table (calculated column) or generated by the data model, (a timestamp).
Table 1: Data Types and Utility Types
| Data Type | Name | Description |
|---|---|---|

|
Text/Text Area |
Use text for providing commentary on a data point, and help you to provide more context to your data. You can also enter a URL (for non-editable columns only). Text Area settings can support multiple rows in a single cell, find out more in our article here. |
|
|
Dropdown |
Use a dropdown to select one of multiple options. Also, in release 4.11.0 insightsoftware introduced the multiple choice dropdown feature. You can enable multiple choice dropdowns for columns in your Writeback Table. When you enable this feature for a column in your table, you can simultaneously select multiple options in any row inside this column. To activate the feature, go to the Property Panel > Columns and select a column for which you want to configure multiple choice dropdowns. Make sure that the column Type is configured as Dropdown and enable the Multiple Choice option. The feature doesn't apply if the associated fields are used or when dropdown uses numeric values. |

|
Check box/Toggle |
Use a check box if you need to return one answer of a binary option (e.g. Enable/Disable). |

|
Rating |
Ratings are useful for measuring data linked to performance as a value selected from a set of symbols (e.g. 4/5 stars). |

|
Icon |
Icons are a visual identifier which you can use alongside text to highlight your data. Supports a maximum of 10,000 rows. |

|
Color |
Select a color from the pre-defined palette, or configure your own by using a color code. |

|
Date |
Display dates in a variety of formats, and set minimum and maximum date checks. |

|
Flag |
Add extra visuals to country-specific data by displaying the corresponding country flag. Supports a maximum of 10,000 rows. |

|
Chips (Array) |
Use chips for displaying and sorting arrays, and they can also support tagging within a dataset. |

|
Numeric |
Use the numeric data type to collect and display data in a particular numeric format. |

|
Slider |
Sliders represent a scale between 2 points where the cursor is used to set a value, they're useful for indicating performance metrics. |

|
Radio Button |
The radio button data type presents lists of options, but unlike a drop-down the entire list is still displayed after one of the options is selected. |

|
Multiple Choice |
Multiple choice presents a list of options which remain visible once a choice has been made, but allow for more than one selection to be made. |

|
Expression |
Configure your own data properties with the built-in Qlik Sense Expression Editor. You can display the result as text or as a color. |
| Utility Type | Name | Description |
|---|---|---|

|
Calculated Column |
Use Calculated Columns to take data from other columns in the table, make calculations and display the results (either as text or as an image). Note: Calculated columns should be used with writeback Update operations instead of measures or calculated dimensions, as they are excluded from the matching process which determines which values to update. Measures or calculated dimensions should not be used as they can cause duplication of values held in the data source. |

|
Timestamp | Use timestamp if you want to add a system-generated time measurement. |
Working with Columns
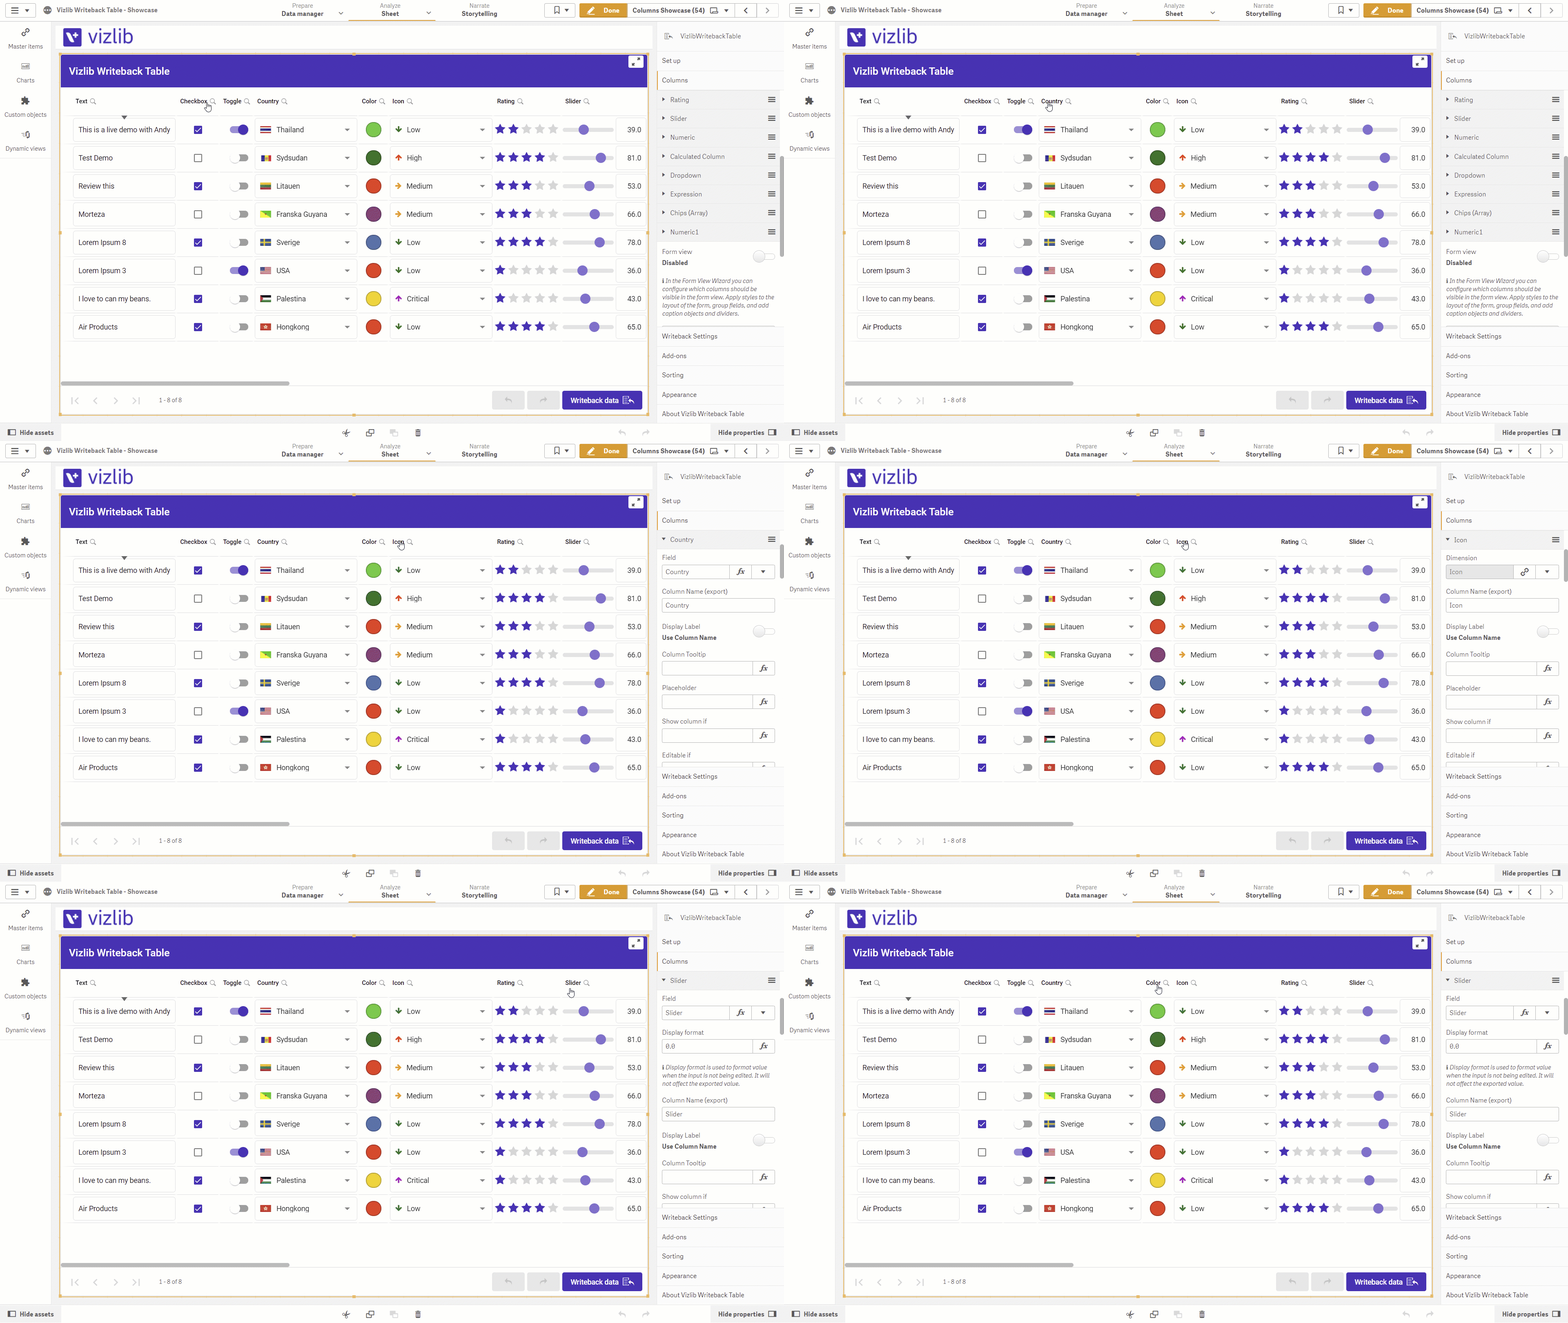
Column properties in Vizlib Writeback Table are held in the property panel. The easiest way to start editing columns is to click the name in the table when you're in edit mode (Figure 1) which opens the column properties in the property panel.
Figure 1: Column Properties
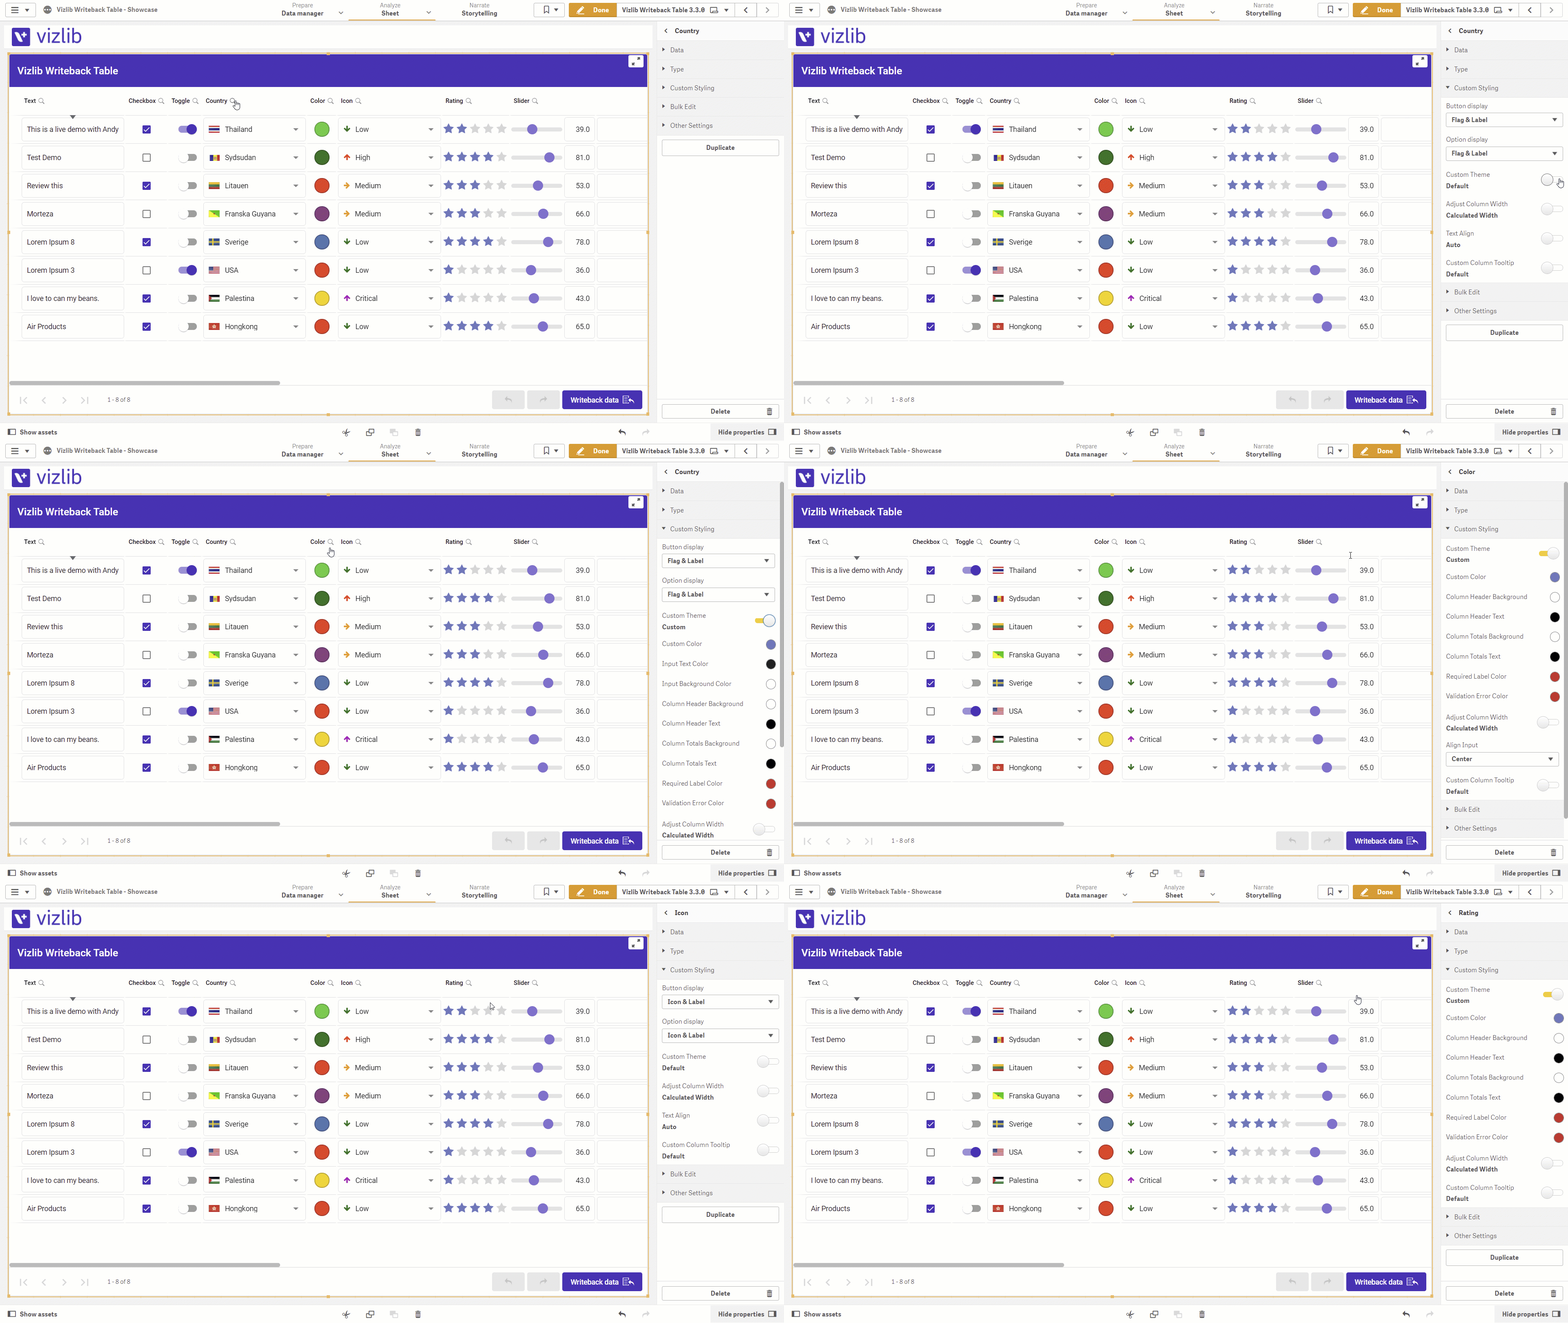
In version 3.3.0 of Vizlib Writeback Table, we've updated the look and feel of the property panel (Figure 2). If you click on a column, the properties expand from the side and display at the top, making them easier to view and edit. Settings are also grouped, so if you open a section of properties (e.g. custom styling) and click on another column, the same settings will open for that column, making it quicker and easier to navigate and edit settings for multiple columns.
Figure 2: Property Panel v3.3.0
Vizlib Writeback Table Column Properties - HTML Tooltips
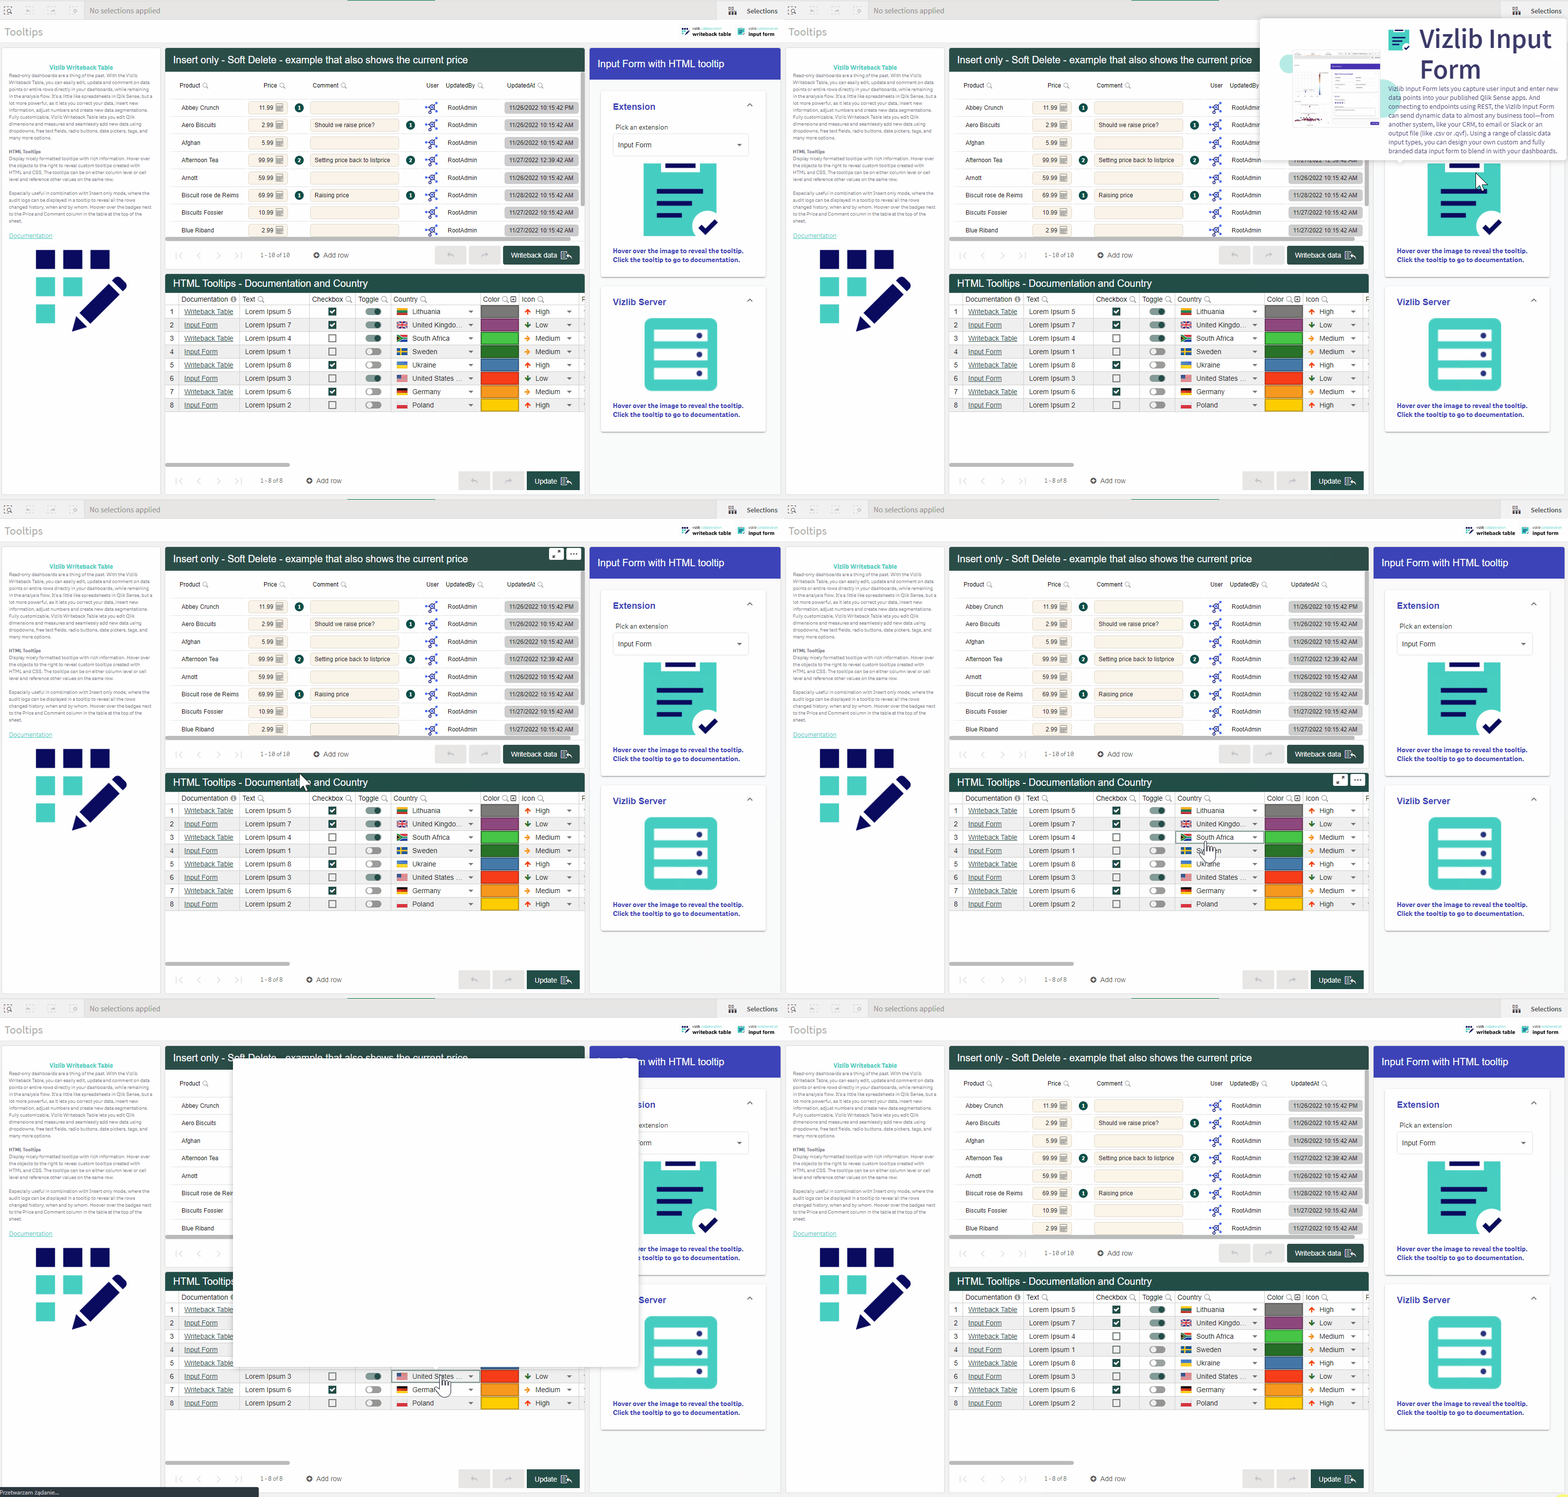
The HTML Tooltips feature enables you to configure tooltips for cells in Vizlib Writeback Table columns in such a way that data is presented with more context. You can do it by going to the Property Panel > Columns > [Column Name] > Tooltip > Tooltip Settings. A tooltip can be either plain text or HTML format. You can choose a suitable format using the Interpret Cell Tooltip property. To define a tooltip, use the Cell Tooltip field, in which you can simply type or paste a plain text or HTML code. Finally, you can enable the Cell Tooltip Style option and further define such properties as a tooltip height, width or font color.
Figure 3: Tooltips in Vizlib Writeback Table
Vizlib Writeback Table Column Properties - Dynamic URL Labels
With the use of the Text as URL property in Vizlib Writeback Table, you can transform text input into links on a column level. The property applies to a column that is a dimension or measure and is non-editable. You can enable the Text as URL property by going to the Property Panel > Columns > [Column Name] > Type > Text is URL. Using the URL Label field, you can define the link text. Using a Qlik expression, you can decide whether the link is static or dynamic.
Adding Timestamps Using Columns
While you can currently add a timestamp as a utility type, the function to add a timestamp for input in Vizlib Writeback Table is not yet available. There are two methods we recommend for inputting a timestamp using columns:
-
Use two drop-downs - Add a drop-down data type to input hours, and another one for inputting minutes. You can combine them when you are reading the data back if you need to.
-
Use a Text data type field and add validation with the Regex (regular expression) option (Figure 3).
Figure 4: Regex
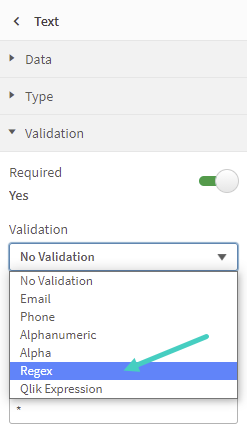
We've listed an example Regex for a timestamp here.
= '(0[0-9]|1[0-9]|2[0-3]):[0-5][0-9]'
Calculated Column Image Display
With v3.8.0 of Vizlib Writeback Table, you can use an image to display results in a calculated column utility type. In the Type section of the column settings, you can select the Display Mode as image or text. Once you've set the display mode to Image, you can enter an expression in the editor containing the image url (remember to wrap the URL in single quotes or it won't be validated). If you need to edit the image size within the cell, you can use the Adjust Image Height settings in Custom Styling. Figure 4 shows an example of an image being added and adjusted.
Figure 5: Display as Image
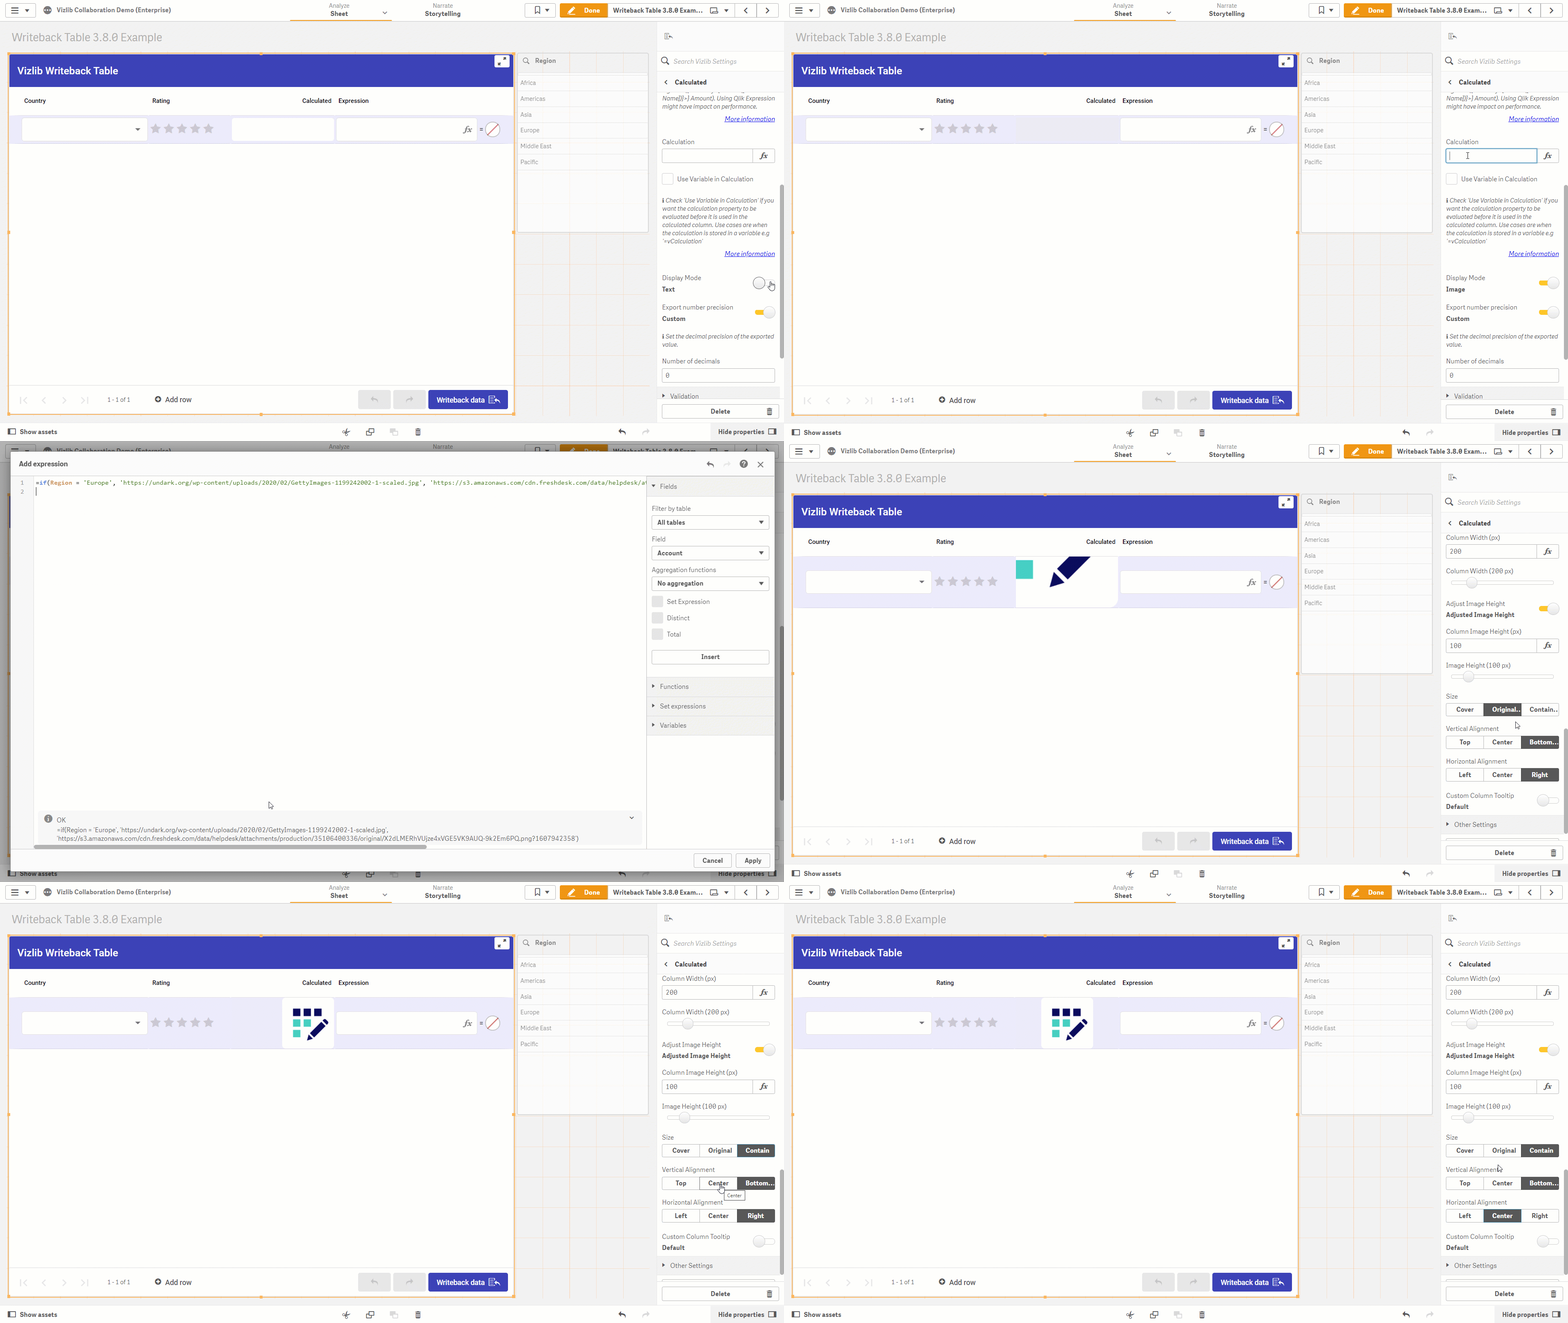
This setting could be used with complex expressions, where a specific image is displayed when a condition is met.
Evaluate Expression as Color
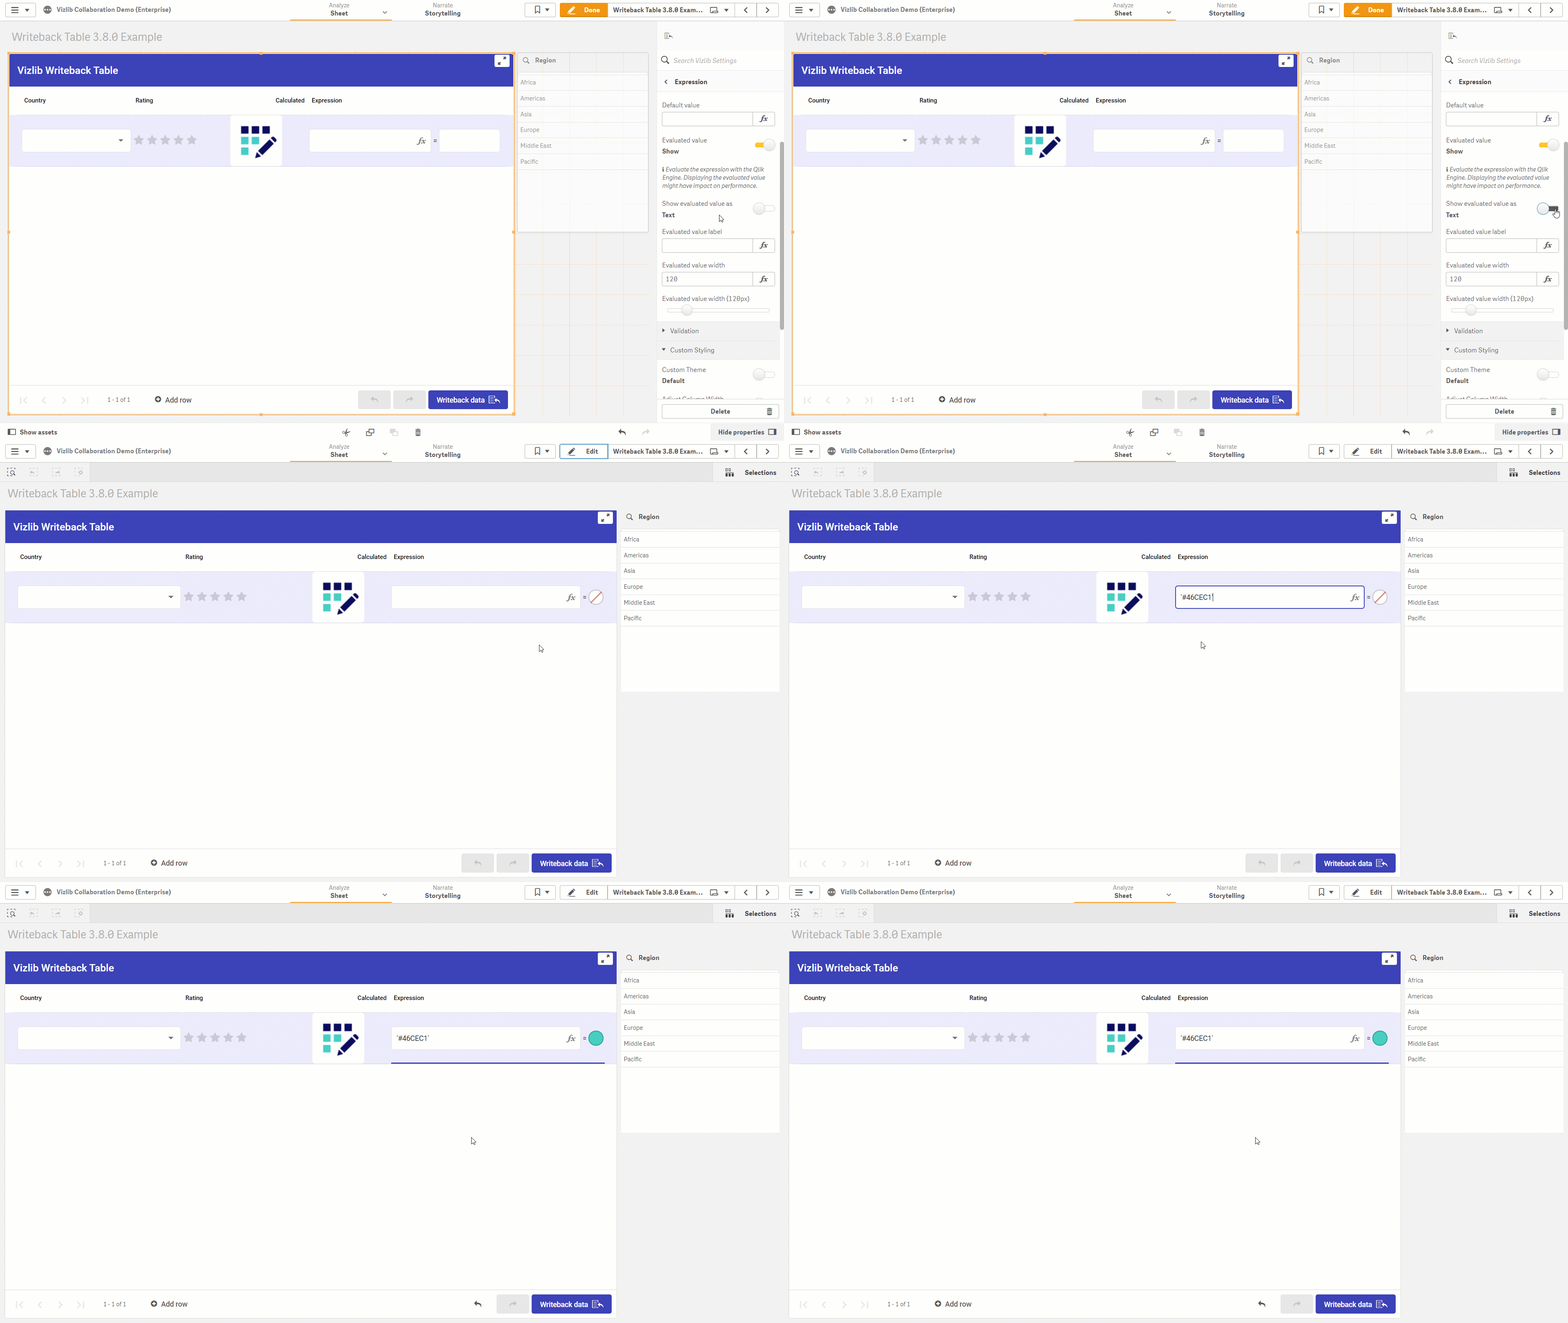
With v3.8.0 of Vizlib Writeback Table, you can evaluate the Expression data type as either text or a color. In the Type settings for the column, you can set Show evaluated value as to Color, then display a color when the evaluation uses a hex color code. Figure 5 shows the evaluation display changing color when a color code is entered.
Figure 6: Expression as Color
