Properties - Reference Lines
Vizlib Combo Chart supports Reference Lines for both the x- and y-Axis.
This topic contains the following sections:
Label
If you choose to add a Reference Line (Figure 1), you can enter a Dimension Value, customize a Label, and set the Font Color, Font Size, Text Opacity, Font Style, and choose how to Align the label.

Figure 1: Label
Outline
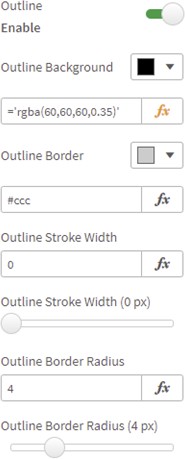
If you choose to enable an Outline (Figure 2), you can set the Outline Background, Outline Border, Outline Stroke Width and Outline Border Radius.

Figure 2: Outline
Line
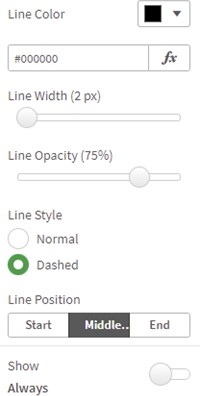
You can also choose a Line Color (Figure 3), and set the Line Width, Line Opacity, Line Style, and Line Position. You can also choose to Always show the reference line, or show it only if a Condition is met.

Figure 3: Line
Example
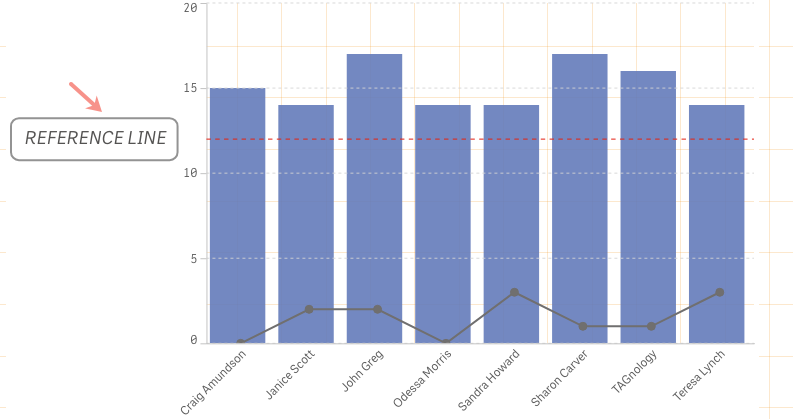
Figure 4 shows an example of a Reference Line.

Figure 4: Example