Properties - Appearance
The Appearance settings control the look and feel of your Vizlib Flow Chart.
This topic contains the following sections:
General Appearance Settings
In the General section (Figure 1), slide the Show titles toggle to the right to show or hide a Title, Subtitle, and Footnote.
Slide the Show details toggle to the right if you want to Show or Hide details. Details include the descriptions, measures, and dimensions used.
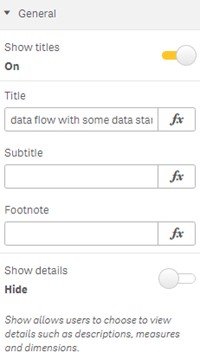
Figure 1: General
Links Styling
Links Styling (Figure 2) contains settings for styling the links in the flow chart.
Slide the Color mode toggle to the right to choose the option to blend in (that is, inheriting the colors of connecting nodes and blending them together), or apply a solid color.
Use the slider to set the Links Opacity (set as a percentage).
Slide the Links Value Labels toggle to the right to Show a label. You can also set the:
-
Link Label Font Color - using the color picker or entering a Hex code.
-
Links Label Font Size - enter the font size or use the slider to select the size.
-
Links Label Font Style - apply bold, italics, or underlined formatting.
Note: Use italics sparingly, as they can reduce readability.
-
Links Label Position - use the slider to select the position of the Link Label (for example, if it's set at 50%, the labels display in the middle of each node).
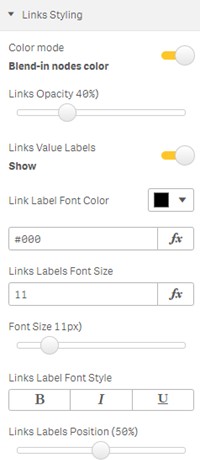
Figure 2: Links Styling
Nodes Styling
Nodes Styling (Figure 3) allows you to apply styling to the nodes in the flow chart.
Use the sliders to set the Nodes Width and Distance between nodes (measured in pixels).
You can also set the Border Color using the color picker or enter a Hex code. And use the slider to set the Nodes Border Width (measured in pixels).
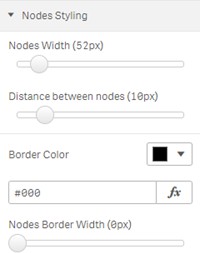
Figure 3: Nodes Styling
Label Settings
The Label settings (Figure 4) have the same style settings as the Link Labels:
-
Label Font Color - using the color picker or entering a Hex code.
-
Label Font Size - enter the font size or use the slider to select the size.
-
Label Font Style - apply bold, italics, or underlined formatting.
Note: Use italics sparingly, as they can reduce readability.
Click on either vertical or horizontal to choose the Label Orientation.
Click the option to have the Label inside the node or deselect the option so the label displays closer to the middle.
Click the option to set the Node label length limit. Set the character limit using the slider that displays. The label length maximum is 100 characters.
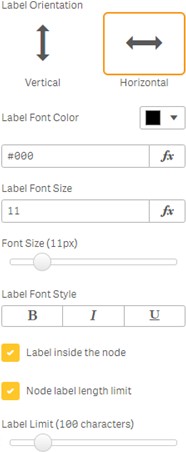
Figure 4: Nodes Styling Label
Value Styles
The settings for Value styles are the same as Label styles.
Applying Colors
There are two options for applying Colors to a flow chart. Select whether to color by Dimension or by Node (Figure 5).
Color options include using custom colors (comma-separated list of HEX colors) or one of the color schemes offered. You can also reverse the colors, which inverts the selected colors (Figures 5, 6, and 7).
Coloring by Node
Use the Color by Node (Figure 5) option to choose a Coloring Type:
-
Gradient - colors the node based on measure value.
-
Classes - colors each node distinctly.
-
Expression - an expression field displays for you to enter a custom color (Hex code) that applies the color to each node displayed.
-
Sequential - colors the nodes with a user's defined range.
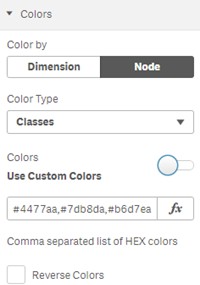
Figure 5: Color by Node
Using Sequential Colors
Sequential colors are defined by the user manually selecting the range at which colors are presented. The GIF below (Figure 6) shows that the colors are presented based on my parameters.

Figure 6: Sequential Coloring
Coloring by Dimension
Select Color by Dimension (Figure 7) to highlight the dimensions in your flow chart.
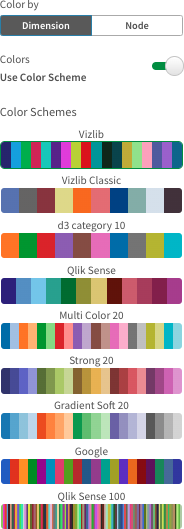
Figure 7: Color Scheme options
Dimension Titles
Slide the Dimension Titles (Figure 8) toggle to the right to Show the dimension titles.
Select either Top or Bottom for the title's Position. Other style options for Dimension titles include:
-
Font Color - using the color picker or entering a Hex code.
-
Font Size - enter the font size or use the slider to select the size.
-
Font Style - apply bold, italics, or underlined formatting. Please note: use italics sparingly, as they can reduce readability.
-
Background Color - using the color picker or entering a Hex code.
-
Background Opacity - use the slider to set the opacity (set as a percentage)
Use the options:
-
Show alternative count - using an Alternate state.
-
Show drill-down breadcrumbs - drill-down view showing any hidden dimensions.
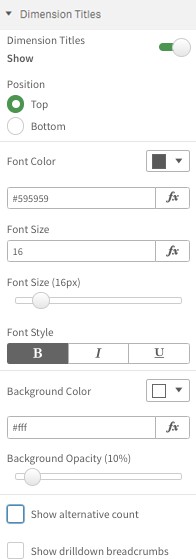
Figure 8: Dimension Titles
Measure Title
Slide the Measure Title (Figure 9) toggle to the right to Show the measure title. The settings for Measure Title are the same as Dimension Titles.
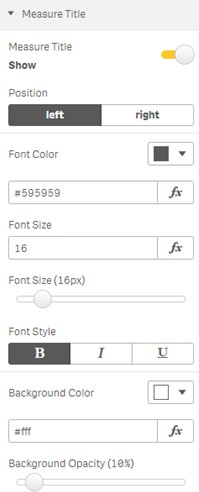
Figure 9: Measure Title