Properties - Interactivity, Alternate States, Viztips and Tooltips
Learn more about applying Interactivity, Alternate States, and both Viztips and Tooltips for Vizlib Flow Chart.
This topic contains the following sections:
Interactivity Settings
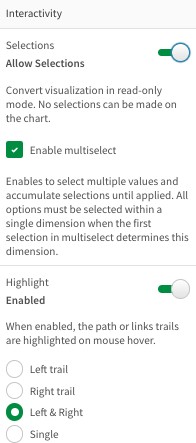
Use the Interactivity settings (Figure 1) to control how users interact with your Vizlib Flow Chart.
Selections
Slide the Allow Selections toggle to the right to convert visualizations from the read-only mode, where no selections can be made on the chart.
Click the check box beside Enable Multiselect to allow users to select multiple values and accumulate selections until you apply them.
Note: All options must be selected within a single dimension, and the first selection in your multi-select determines this dimension.
Highlight
Slide the Highlight toggle to enable the path or links trails to be highlighted when a user's mouse hovers over them.
Select from Left trail, Right trail, Left & Right, or Single to apply the highlighting.

Figure 1: Interactivity options for selections and highlighting.
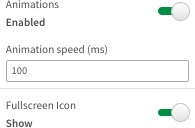
Animations
Slide the Animations toggle to the right to enable animation in the chart. Use the field to set the Animation speed in milliseconds.
Slide the Fullscreen Icon toggle to the right to display the fullscreen icon (the two diagonal arrows beside the context menu).
Click the icon to open a full-screen version of the flow chart.

Figure 2: Animations options
Viztips and Tooltips
The Viztips and Tooltips settings help you to manage tooltips in Vizlib Flow Chart, and you can also enable Viztips to add dynamic tooltips.
Please read more in our Viztips - Overview article.
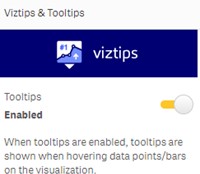
Slide the Tooltips toggle to the right, then the message Enabled displays (Figure 3). After Tooltips are enabled the Viztips options (Figure 4) display, and you can start working with dynamic tooltips.
Please also see our Viztips example app.

Figure 3: Viztips and Tooltips
Using Master Items with Viztips
Viztips can present Master Items on the Flow Chart nodes and connections, as seen in Figure 4.

Figure 4: Viztips used as a master item added to a Vizlib Flow Chart.
Alternate State
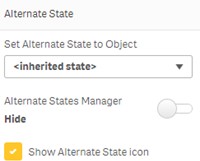
Alternate State (Figure 5) allows you to assign the Vizlib Flow Chart to an alternate selection state. Please see our article on Alternate States to learn more.

Figure 5: Alternate State