Properties - Appearance
The Appearance settings control the look and feel of your Vizlib Grid Chart, helping you apply custom features and colors.
This topic contains the following sections:
General
With General settings (Figure 1), you can choose to Show titles, entering a Title, Subtitle, Footnote and select to Toggle off hover menu.
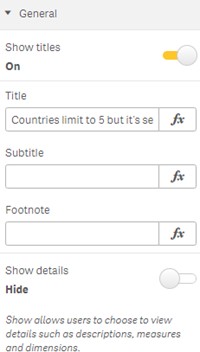
Figure 1: General
Alternate States
Alternate States (Figure 2) allows you to assign the Vizlib Grid Chart to an alternate selection state. You can find more on alternate states here.
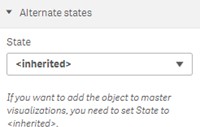
Figure 2: Alternate States
Presentation
In the Presentation settings (Figure 3), you can choose to Show Values, set a Display Mode, select the Point Shape and use the slider or Input Fields to set the Point Size. There is the Scale option which is either Auto or Fixed.
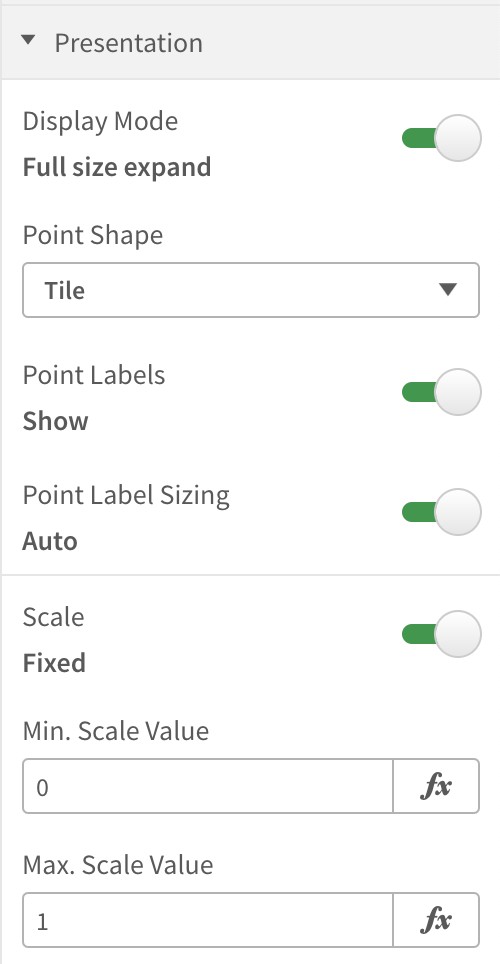
Figure 3: Presentation
X-Axis
In the X-Axis settings (Figure 4) you can set the Axis Position, choose to Show or Hide the Axis Title, set the Title Font Color, Title Font Size, Title Font Family, and Enable Title Breadcrumbs.
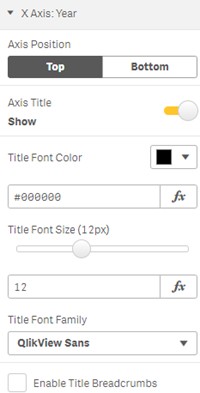
Figure 4: X-Axis Title
The Label settings (Figure 5) allow you to Show or Hide Axis Labels, set the Label Font Color, Label Font Size, Label Char Limit, and Label Orientation.
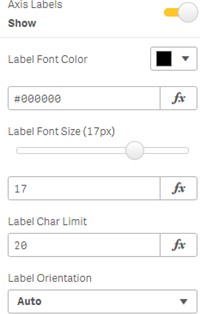
Figure 5: X-Axis Labels
Note: Please check, and adjust if required, the Label Char(acter) Limit if the label on a chart is getting cut off.
Y-Axis
In the X-Axis settings (Figure 6) you can set the Axis Position, choose to Show or Hide the Axis Title, set the Title Font Color, Title Font Size, Title Font Family and Enable Title Breadcrumbs.
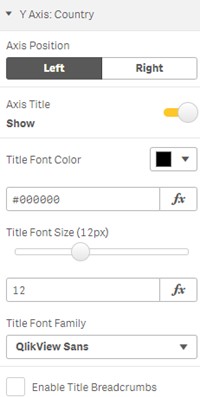
Figure 6: Y-Axis Title
The Label settings (Figure 7) allow you to Show or Hide Axis Labels, set the Label Font Color, and Label Char Limit.
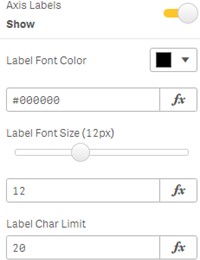
Figure 7: Y-Axis Labels
Note: Please check, and adjust if required, the Label Char(acter) Limit if the label on a chart is getting cut off.
Colors
Colors in Vizlib Grid Chart allow you to choose between three different Coloring Types: Single (applying a single color), Sequential (choosing from a color palette), and Expression (setting colors using a standard Qlik Sense expression). Figure 8 shows a sequential color setting, including options to Reverse Colors in the display and set a Null Value Color.
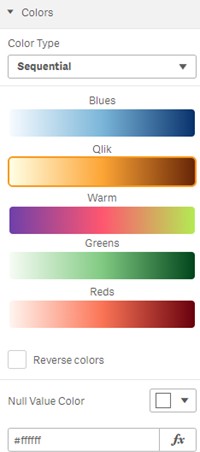
Figure 8: Colors
Legend
The Legend settings (Figure 9) control the legend in the grid chart. If you enable Show Legend, you can set the Legend Orientation, Legend Position, Legend Title and Title Font Color.
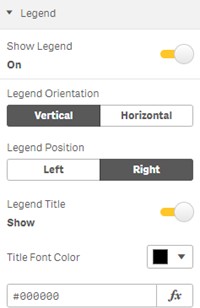
Figure 9: Legend
You can also choose to show Legend Labels (Figure 10), set a Tick Font Size, enable Min/Max Tick Values, and set a Values Format and a Negative Values Format.
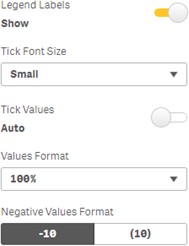
Figure 10: Enable Animations, Title