Properties - Data, Sorting and Data Handling
When you're working with the data in Vizlib Heatmap, you can apply changes in the Data, Sorting and Data Handling settings.
This topic contains the following sections:
Data - Dimensions and Measures
The Data section contains settings for the dimensions and measures in the heatmap.
Vizlib Heatmap supports two dimensions, one for the X Axis and one for the Y Axis (Figure 1). You can choose to Include null values, set a Limitation from the drop-down (you can choose between a a fixed number (e.g. top 10 values only), an exact value and a relative value (e.g. show the top 50% of results). You can also add alternative dimensions by clicking Add alternative. There's more information about alternative dimensions in the Best Practice article.

Figure 1: Dimensions
Vizlib Heatmap also supports two measures (Figure 2), the first controls the color and the second is displayed as you hover over the heatmap. You can choose to enable Master measure formatting, which means that formatting properties will be inherited from the master item used by the measure, and select a Number formatting option.
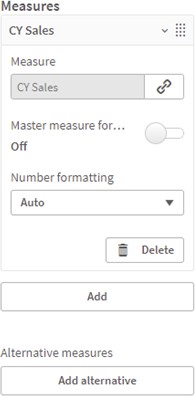
Figure 2: Measures
Sorting
The Sorting settings (Figure 3) allow you to customize the sort method used. You can Sort by expression, Sort numerically or Sort alphabetically. You can find more information on sorting in Qlik Sense here.
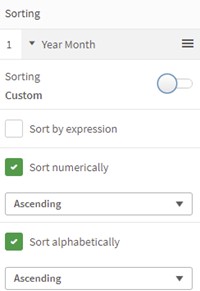
Figure 3: Sorting
Data Handling
With Data Handling (Figure 4), you can choose to Suppress Zero Values, if you don't need them to be displayed, enter a Calculation condition which needs to be met for the heatmap to make any calculations, and customize a Displayed message for the condition.
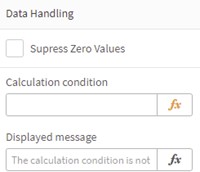
Figure 4: Data Handling