Setup Wizard
Vizlib KPI Designer has a Setup Wizard to help you create a visualization quickly and easily.
To start working with Vizlib KPI Designer, open an app in Edit mode.
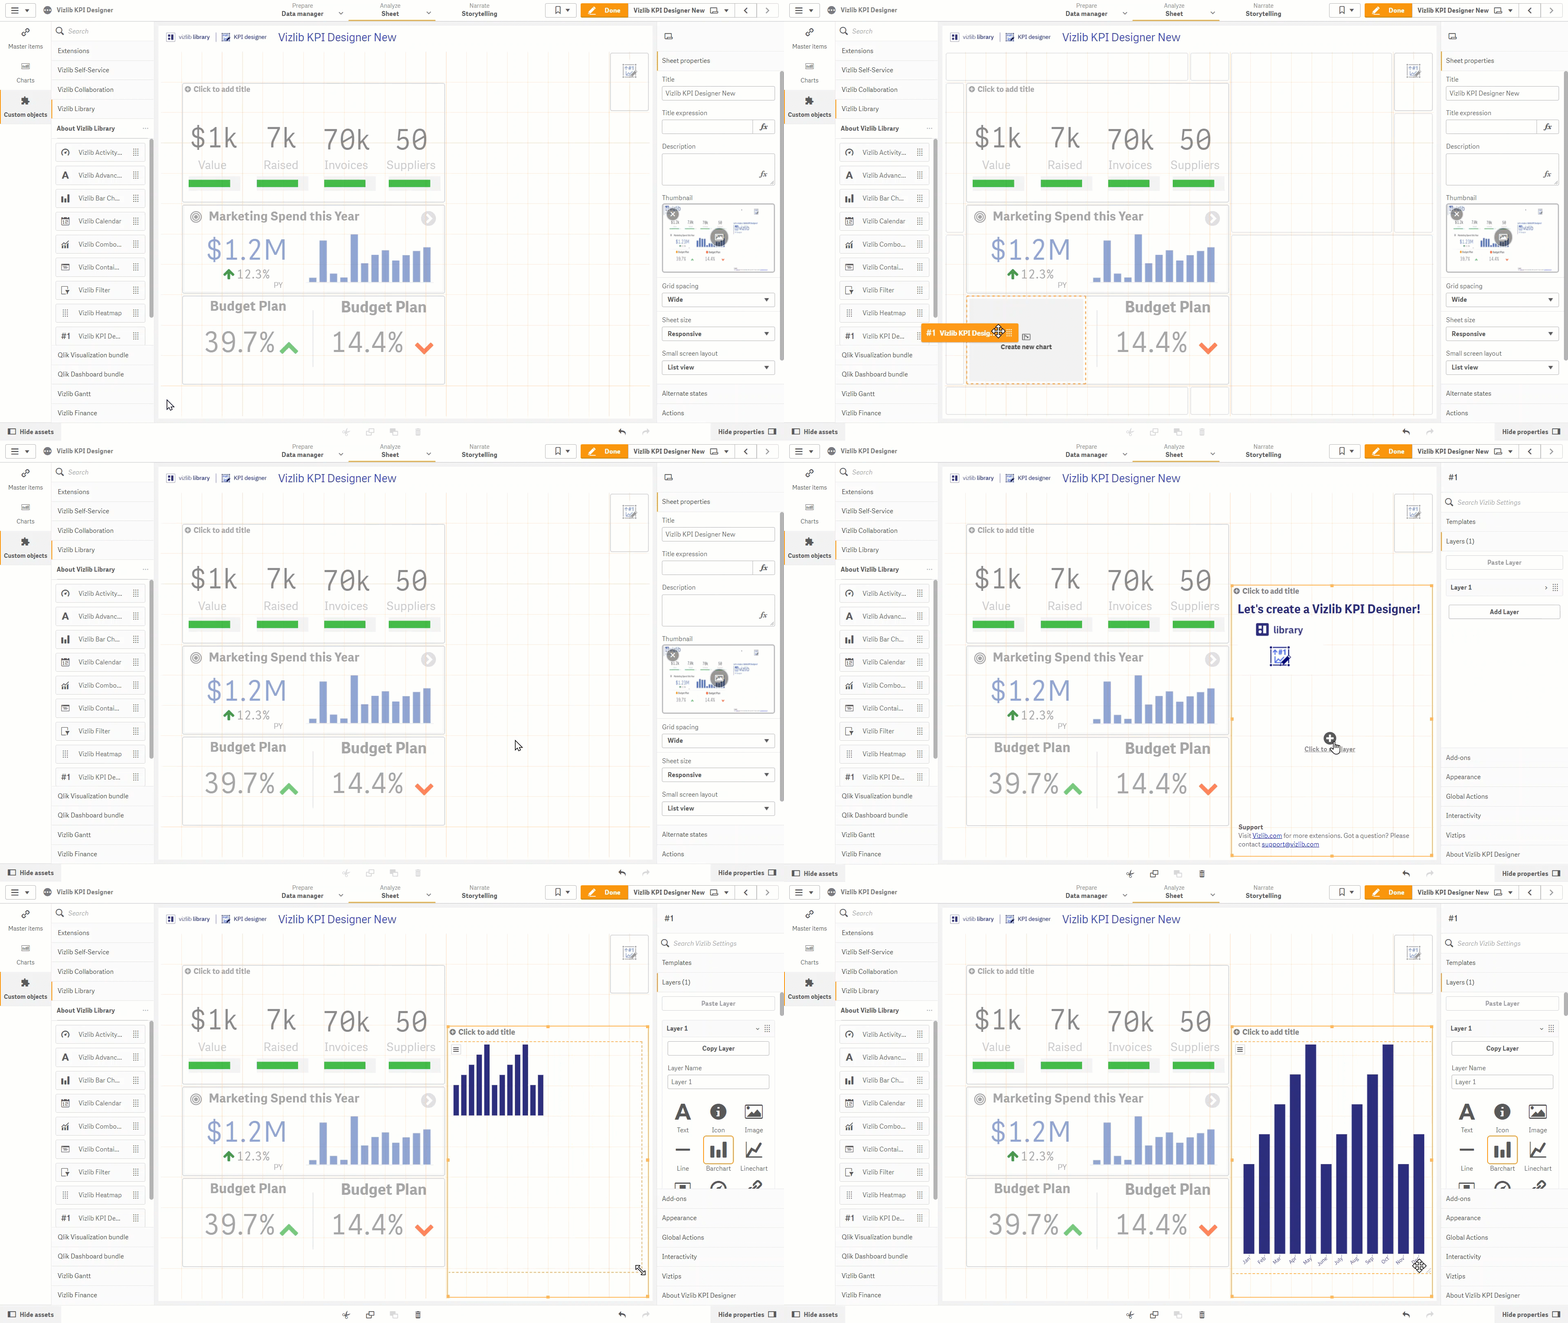
Vizlib KPI Designer is held in the Vizlib Library tab of Custom Options. If you want to create a new layer within a sheet, follow these instructions. Figure 1 shows a KPI Designer object being added.
-
Drag and drop the Vizlib KPI Designer object into the sheet.
-
Once you've added the object, you'll have two options: Click to add layer and Choose Template. This example uses Click to add layer, you can find out more about Choose Template here.
-
Select the layer you want to add, then drag the edge to re-size it if you need to. Edit the layer properties using the Layers section in the property pane.

Figure 1: Add New KPI Designer Layer