Guidance
Vizlib's guidance documentation is your resource guide to making the most of Vizlib products. This documentation focuses on the Vizlib KPI Designer, so that the people working with this extension can find useful information to improve performance and succeed with the extension.
This topic contains the following sections:
-
Best Practice
-
Known Issues
-
Limitations
-
Tech Understanding
Best Practice
-
Performance
-
The chart uses the Qlik Sense hub engine, and each value will be processed separately. We can find more information in our Best Practices and Performance Optimization article in Qlik Sense.
-
Use the 'basic charts'/KPI Default charts where possible. This improves performance Try to keep to less than 10 layers within a single KPI Designer
-
The KPI Designer
-
-
Text scaling
-
If the text is not automatically scaling, then this is because the font size is fixed.
-
Helpful resources:
The KPIs DECODED: Unravelling Library Tips & Tricks helps to explain some best practices when using the Vizlib KPI Designer. Watch the webinar below.
Known Issues
-
Tooltip
-
Tooltips are not displayed on mobile devices.
-
-
Custom Context Menu
-
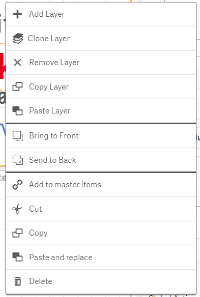
The custom context menu (Figure 1) is not shown when launching Qlik Sense using the desktop client. To display the menu, navigate to http://localhost:4848/hub/my/work, which will run much faster in a modern browser like Google Chrome or Firefox.
-

Figure 1: Custom Context Menu
Limitations
-
NPrinting
-
Master item layers are not supported with Qlik NPrinting when using them within the KPI Designer.
-
Tech Understanding
-
VizTips
-
The KPI Designer is used for VizTips.
-