Properties - Appearance
This topic contains the following sections:
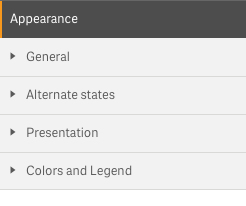
Appearance
General
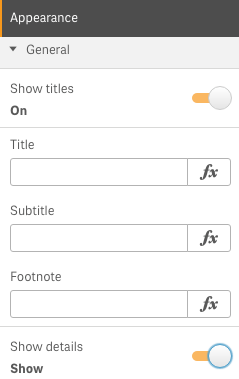
In the General section, you can add a standard Qlik Title, Subtitle and Footnote for your Vizlib Mekko Chart.
-
Shown Title and Subtitle will appear above the Mekko Chart.
-
The Footnote will be shown under your object.
-
Show allows users to choose to view details such as descriptions, measures and dimensions.
Alternate States
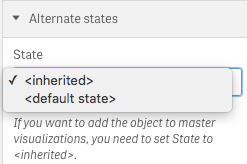
Alternate States permit you to assign the Vizlib Mekko Chart to an alternate selection state. You can find more about alternate states here.
Presentation
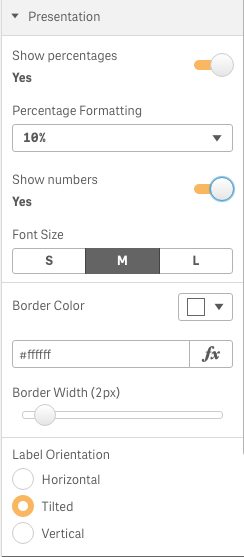
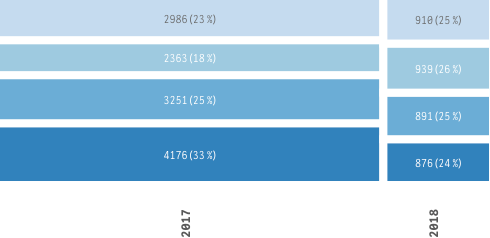
Show Percentage
Show/hide the values in percentage.
Percentage Formatting
Choose the way of representing the numbers of percentage.

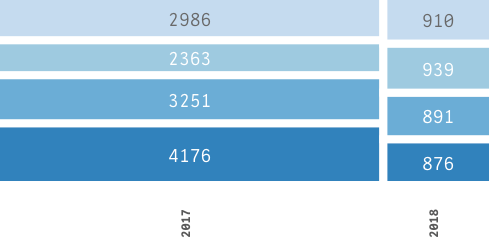
Show Numbers
Show/ hide values in numbers.
You can show both numbers and percentage.
Font Size
Choose the small/ medium/large size of the shown numbers.
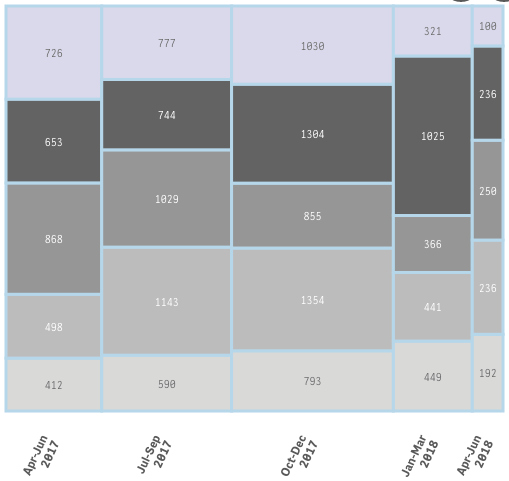
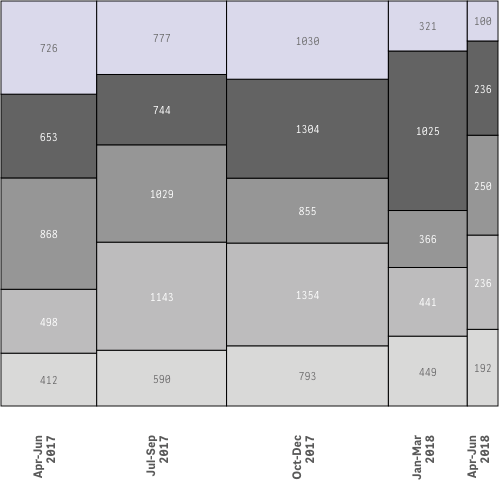
Border Color
Choose the color of the borders between the cells using color- palette or standard Qlik expression.
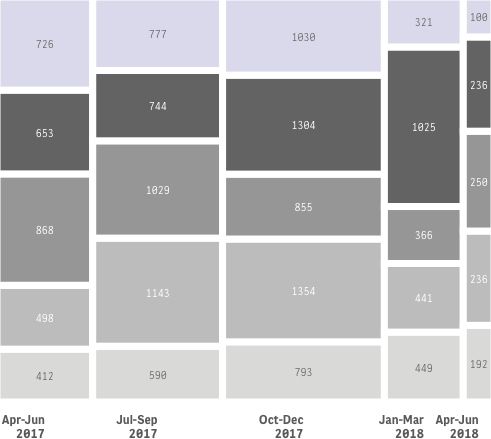
Border Width
Define the thickness of the borders.
Label Orientation
Choose between displaying the title label horizontally/vertically/or in the middle.
Colors and Legend
Colors
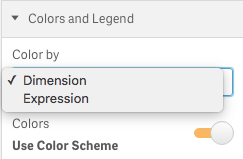
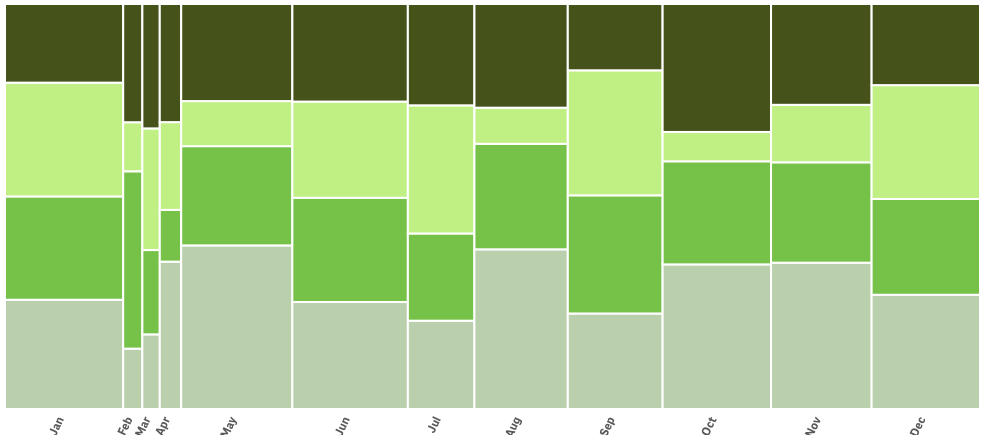
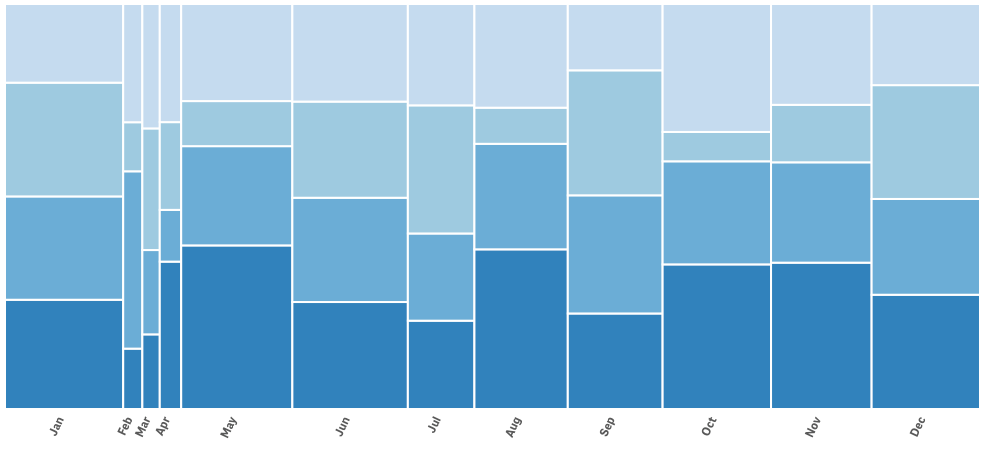
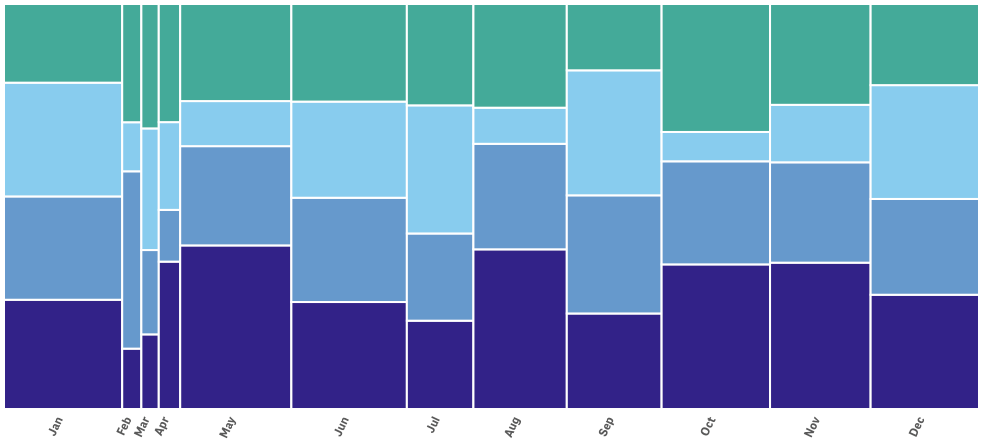
Color your Mekko Chart by dimension or expression. You can use the color scheme or set the range of custom colors.
Reverse colors
Reverse the order of colors defined by your color palette.
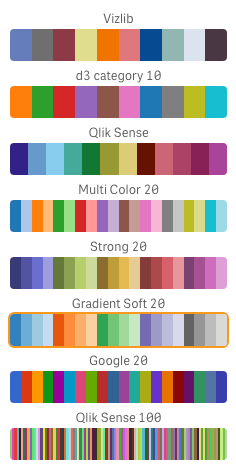
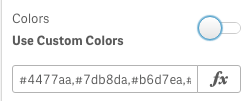
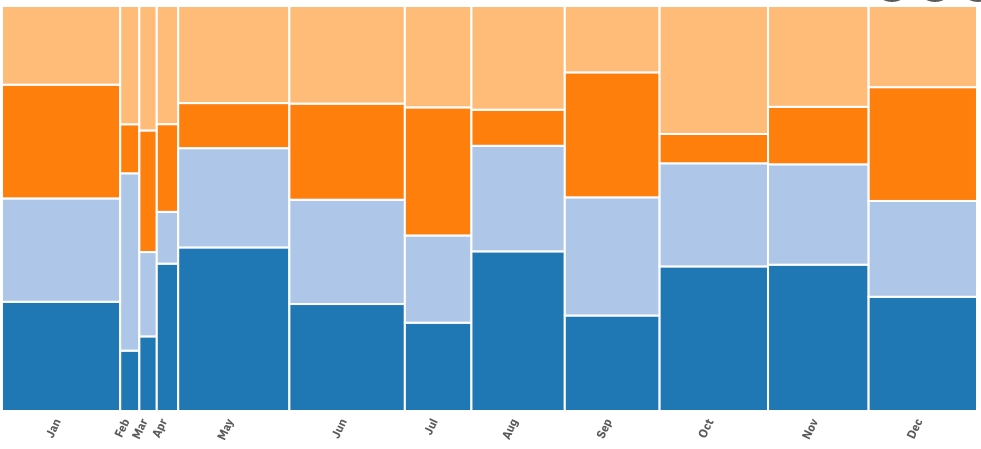
Examples:
Legend
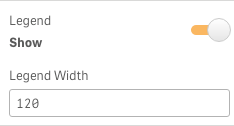
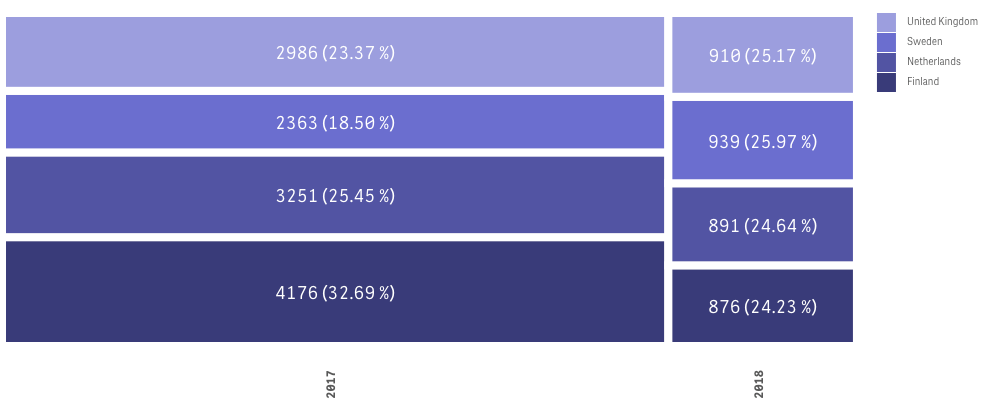
Show/ hide the legend and define the legend width.
