Vizlib Pie Chart - Older Releases

New Feature
The following features were introduced in older releases of Vizlib Pie Chart:
| Date | Software version | Feature ID | Feature description |
|---|---|---|---|
| 20/09/2022 |
1.11.0 |
LIB-11317 |
Add master item colors to Pie Chart. |
|
29/09/2021 |
1.10.0 |
LIB-10127 |
Context Menu Enhancements. |
|
07/04/2021 |
1.9.0 |
LIB-8427 |
Properties Panel Search. Speed up your chart build, by searching the properties panel to gain quick access to the property you look for |
|
22/10/2020
|
1.8.3
|
LIB-7192 |
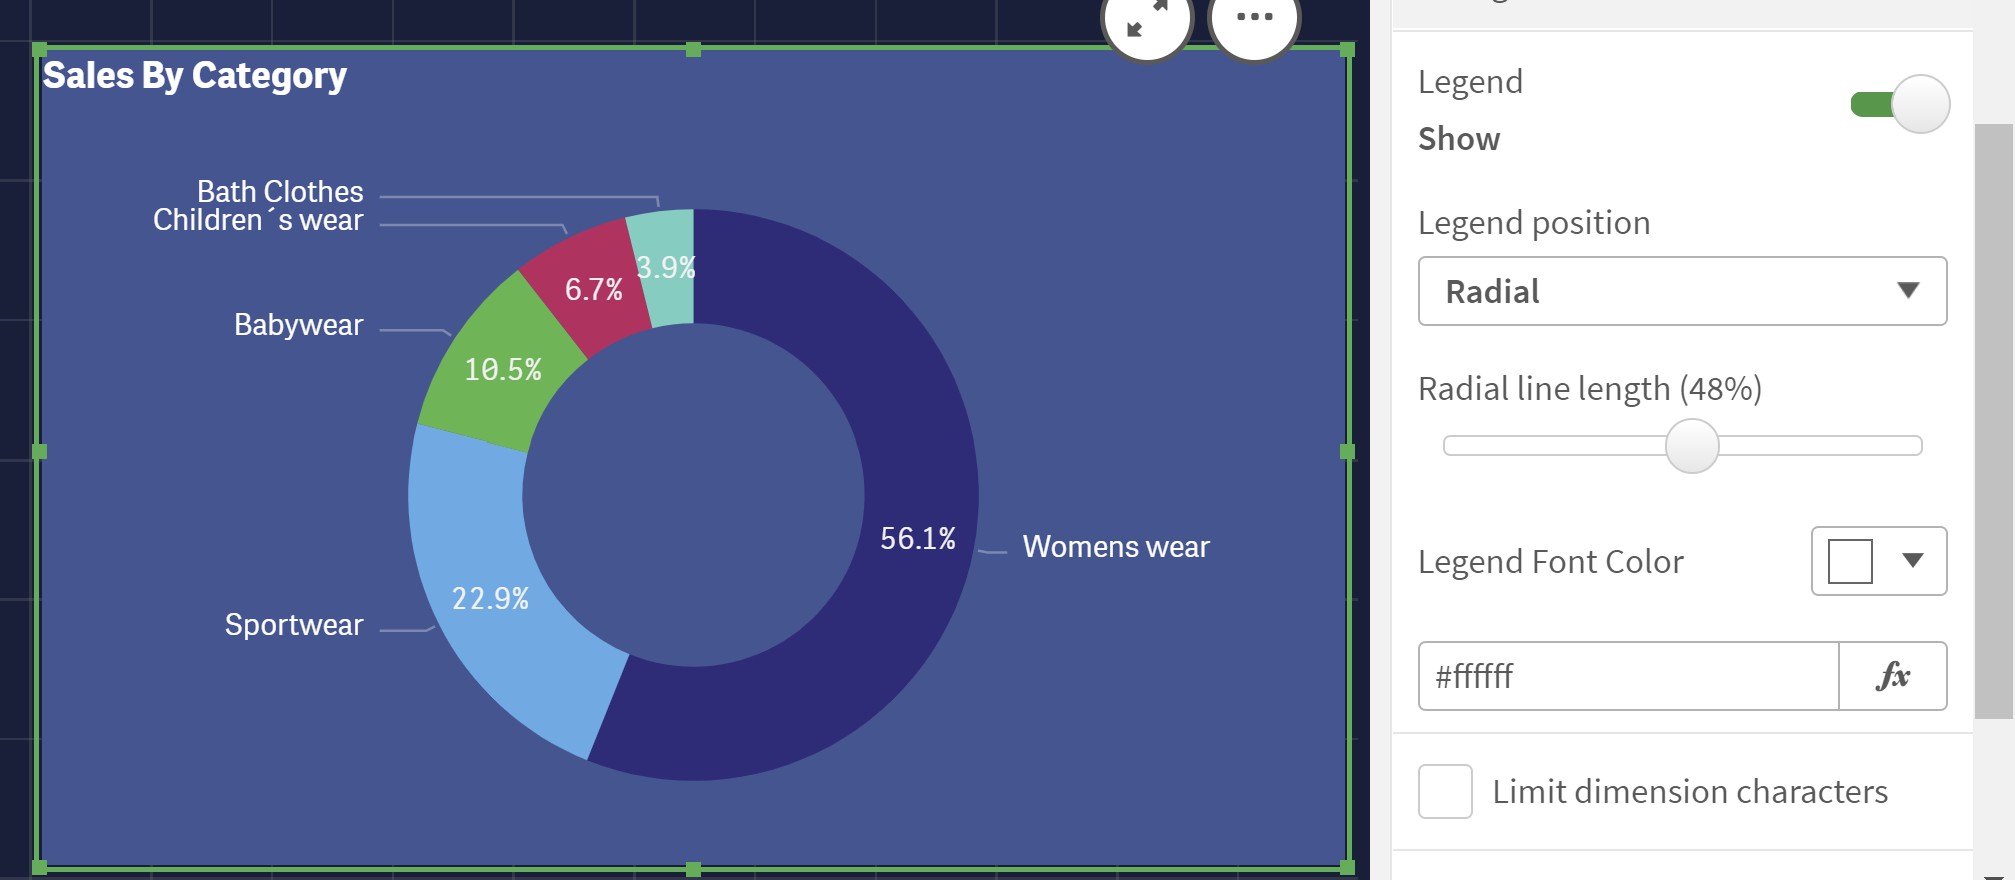
Legend Font Color Ability to customize the legend font color, allow support for Dark themes, Company color palette etc.
|
|
LIB-5148 |
Labels overlap. |
||
|
12/08/2020 |
1.8.2 |
LIB-5248 |
Add option to disable Tooltip in Pie Chart. |
|
12/02/2020 |
1.8.0 |
LIB-4269 |
Improvements to Pie Chart Tool-tip. |
|
29/07/2019 |
1.7.0 |
VZB-1856 |
Memory Optimization. |
|
28/03/2019 |
1.6 |
VZB-832 |
Inherit native number abbreviation formatting from the script. |
|
20/11/2018 |
1.5 |
158821259 |
Add color by dimension & expression + color consistency. |
|
29/10/2018
|
1.4
|
161444084 |
add new measure for slice length / spie chart Bug Fixes. |
|
154150077, 161507585 |
radial legend doesn't use available space properly. |
||
|
161491384 |
cursor doesnt change when hovering legend arrows,. |
||
|
08/10/2018
|
1.3
|
160593374 |
implement pdf/ppt printing. |
|
161050324 |
Added alternative dimensions. |
||
|
23/02/2018 |
1.2 |
- |
Vizlib Pie Chart now supports Alternate States. |
|
08/01/2018 |
1.1.5 |
- |
Add formatting property to inherit the measure formatting for the totals value. |
|
05/12/2017 |
1.1.4 |
- |
Added 'auto' formatting option for measures, so in the tooltip 16,000,000 is displayed as 16M. |
|
26/06/2017 |
1.1.0 |
- |
First Release. |
Resolved Issues
The following issues were resolved in older releases of Vizlib Pie Chart:
| Date | Software version | Bug ID | Description |
|---|---|---|---|
| 20/09/2022 |
1.11.0 |
LIB-11308 |
Pie chart - using dimension in Color by expression has incorrect display. |
|
28/06/2022 |
1.10.4 |
LIB-11268 |
License calculation issue. |
|
24/03/2022
|
1.10.3
|
LIB-10986 |
Console Errors. |
|
LIB-10987 |
Show Legend. |
||
|
15/02/2022
|
1.10.2
|
LIB-10730 |
Tooltip Flickering. |
|
LIB-10846 |
Color by Expression Error. |
||
|
14/12/2021
|
1.10.1
|
LIB-10633 |
Radial Lines Display. |
|
LIB-10630 |
Alternative Measures Menu. |
||
|
29/09/2021 |
1.10.0 |
LIB-3066 |
Measure / Dimension - Font Style. |
|
26/08/2021
|
1.9.2
|
LIB-9176 |
Second Measure Display In Donut Chart. |
|
LIB-9703 |
Data Point Font Color. |
||
|
LIB-9253 |
Legend Display. |
||
|
15/06/2021 |
1.9.1 |
LIB-8991 |
Data Values Display. |
|
26/01/2021 |
1.8.4 |
LIB-8033 |
Tooltip Error in Freemium. |
|
22/10/2020
|
1.8.3
|
LIB-7340 |
Colors Scheme. |
|
LIB-7077 |
Customs Colors. |
||
|
LIB-6750 |
Custom Total Numbers Rounding. |
||
|
LIB-6730 |
Color display upon selection. |
||
|
12/08/2020
|
1.8.2
|
LIB-5149 |
Persistent colors missing on the pie chart. |
|
LIB-4321 |
Tooltips not displayed in mashup. |
||
|
01/06/2020
|
1.8.1
|
LIB-5147 |
Variables value were not showing in tooltips. |
|
LIB-5216 |
Pie chart legend order does not match pie dimension order. |
||
|
LIB-5841 |
Limit dimension characters doesn't' work properly. |
||
|
LIB-4372 |
Legend not responsive in some cases. |
||
|
12/02/2020
|
1.8.0
|
LIB-4344 |
Display "No Data to display" when values are not available. |
|
LIB-4319 |
Drilldown Icon Incorrect in june'19 & sept'19. |
||
|
LIB-4372 |
Legend not responsive in some cases. |
||
|
LIB-4379 |
Qlik Nov Support - Custom fonts not working. |
||
|
LIB-4475 |
Donut inside value not placed correctly. |
||
|
24/09/2019 |
1.7.2 |
VSP-883 |
Vizlib Pie Chart is blank when certain expressions are used. |
|
19/09/2019 |
1.7.1 |
VZB-2163 |
Corrected typo in data handling section. |
|
24/09/2019 |
1.7.2 |
VSP-883 |
Vizlib Pie Chart is blank when certain expressions are used. |
|
19/09/2019 |
1.7.1 |
VZB-2163 |
Corrected typo in data handling section. |
|
20/08/2019
|
1.6.5
|
VSP-482 |
Pie Chart printing during animations when using NPrinting. |
|
VSP-671 |
Legend not responsive when Pie Chart small. |
||
|
15/07/2019 |
1.6.3 |
VSP-680 |
Visualization API not working with Vizlib Pie Chart. |
|
18/06/2019 |
1.6.2 |
VZB-1478 |
Qlik Sense June 2019 support. |
|
29/04/2019 |
1.6.1 |
VSP-483 |
Vizlib Pie Chart hides some dimension/measure titles of the Vizlib Bar Chart. |
|
28/03/2019
|
1.6
|
VZB-944 |
calc condition message not evaluated as expression (*). |
|
VSP-118 |
No export of Dimension/Measurement Titles in Vizlib Pie Chart to ppt/img/pdf. |
||
|
VZB-522 |
Alternate state panel component inconsistent. |
||
|
30/11/2018 |
1.5.1 |
162306534 |
Corrected issue with story mode printing. |
|
20/11/2018
|
1.5
|
161967823 |
Pie chart doesn't work inside container in some scenarios. |
|
156464406 |
Extensions don't recognise dimensions containing empty values. |
||
|
08/01/2018 |
1.1.5 |
- |
Fixed radial data label & legend overlapping when the legend is positioned at the top. |
|
05/12/2017
|
1.1.4
|
- |
Bug fix with tooltips not showing up in IE and FireFox. |
|
|
Fixed a bug where the tooltip legend was getting cut-off. Legend display was improved. |
||
|
18/10/2017 |
1.1.3 |
|
Fix introduced for WebSocket communication error when extension is embedded in mashups sitting outside of Qlik Sense hostname. |