Properties - Appearance
The Appearance tab manages settings relating to the look and feel of Vizlib Pivot Table.
This topic contains the following sections:
General
In the General tab (Figure 1), you can choose to show or hide a title, add title details using the expression editors and show or hide the pivot table details.
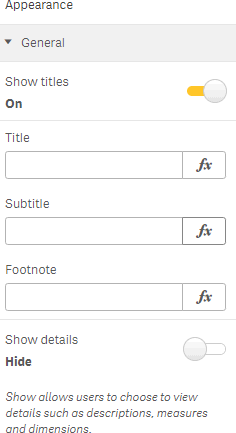
Figure 1: General
Alternate States
Alternate States has settings related to adding the object to master visualizations (Figure 2). You can find more about alternate states here.
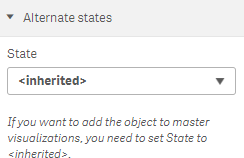
Figure 2: Alternate States
Columns / Rows Definition
Columns / Rows Definition contains several sections which handle the appearance settings for pivot table columns and rows. The Visibility settings (Figure 3) allow you to display or hide measure titles in the pivot table definition panel, showing the components used to construct the pivot table.
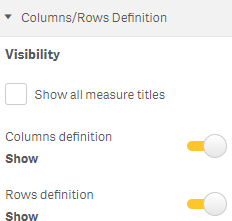
Figure 3: Visibility
Definition Styling (Figure 4) controls the background and font color for the definition panel.
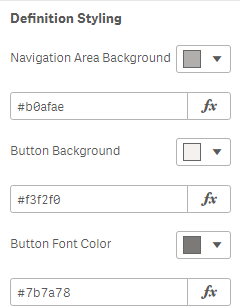
Figure 4: Definition Styling
Enabling Button Borders (Figure 5) allows you to choose color, radius and size of borders for the pivot table buttons.
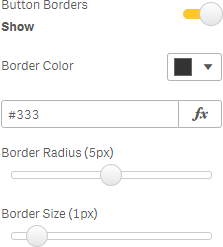
Figure 5: Button Borders
Header Cells
The Header Cells panel controls the appearance of cells in the pivot table header.
Header Settings controls the Header Row Height, and Cells Text has settings for Horizontal Alignment and Wrap Text (Figure 6).
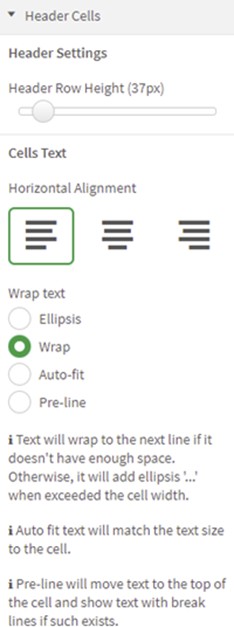
Figure 6: Header Settings
Cells Styling (Figure 7) allows you to choose a background color and font color, size, family and style. There's also a setting for displaying a shadow with cell text.
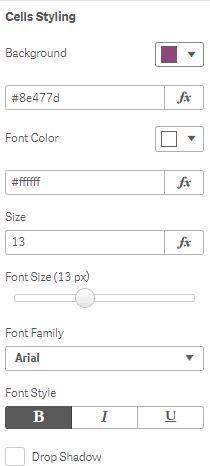
Figure 7: Cells Styling
Enabling Borders (Figure 8) allows you to set the border color and size.
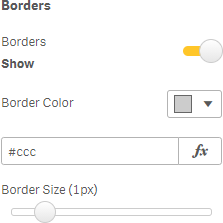
Figure 8: Borders
Note: If you want to Hide the Border to remove all color from the top borders you will see that the resize column element is still present (see vertical line below in Figure 9). To remove this you can type in transparent into the Border color input box, as seen in Figure 10.

Figure 9: Column control border still visible
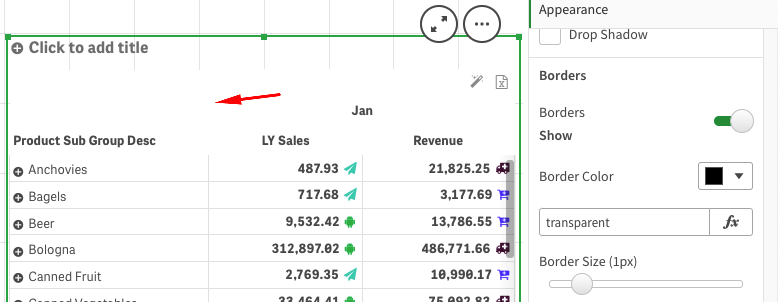
Figure 10: All borders are transparent
Null Cells allows you to set the background and value color for any cells holding a NULL value, as well as letting you define your own Null Symbol (Figure 11).
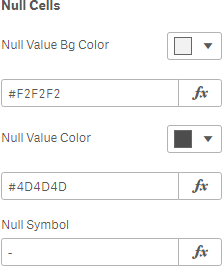
Figure 11: Null Cells
Rows (Left) Cells
Rows (Left) Cells controls the appearance of cells in the pivot table rows. Column Settings controls the Expand Button Position, and Cells Text has settings for Horizontal Alignment and Wrap Text (Figure 12).
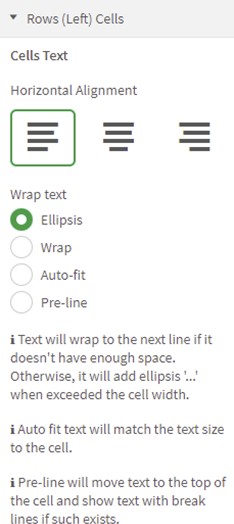
Figure 12: Cells Text
Cells Styling (Figure 13) allows you to choose a background color and font color, size, family and style. There's also a setting for displaying a shadow with cell text.
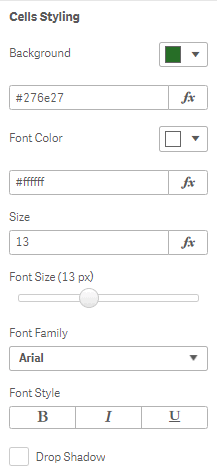
Figure 13: Cells Styling
Enabling Borders (Figure 14) allows you to set the border color and size.
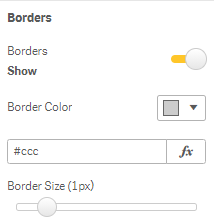
Figure 14: Borders
Null Cells (Figure 15) allows you to set the background and value color for any cells holding a NULL value.
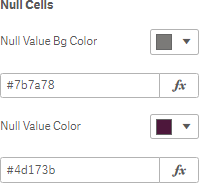
Figure 15: Null Cells
Columns (Right) Cells
Rows (Left) Cells controls the appearance of cells in the pivot table rows.
Cells Text (Figure 16) has settings for text alignment and wrapping within a cell.
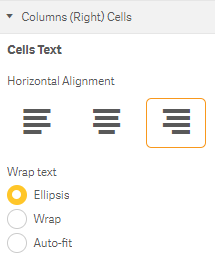
Figure 16: Cells Text
Cells Styling allows you to choose a background type, background color and font color, size, family and style. There's also a setting for displaying a shadow with cell text (Figure 17).
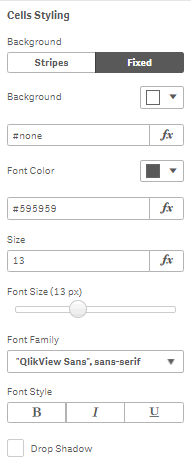
Figure 17: Cells Styling
Enabling Borders allows you to set the border color and size (Figure 18).
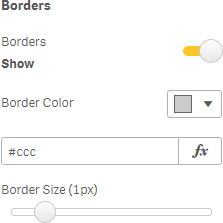
Figure 18: Cells Text
Null Cells (Figure 19) allows you to set the background and value color for any cells holding a NULL value.
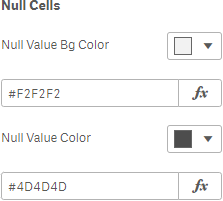
Figure 19: Cells Text
Zero Value Cells allows you to set the background and value color for cells holding a ZERO value (Figure 20).
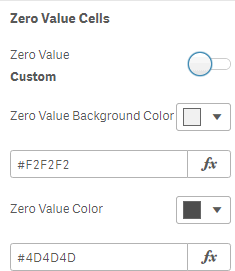
Figure 20: Zero Value Cells
Totals
The Totals settings control the appearance of the cells which display totals for pivot table values.
Position allows you to align the total value within a cell (Figure 21).
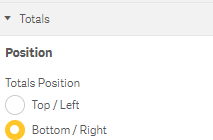
Figure 21: Totals Position
Totals Styling allows you to choose a background type, background color and font color, size, family and style (Figure 22).
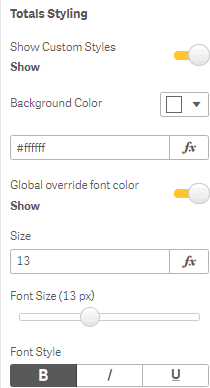
Figure 22: Total Styling