Properties - Appearance
The Appearance settings control the look and feel of your Vizlib Sankey Chart.
This topic contains the following sections:
General
In the General tab (Figure 1), you can choose to show or hide a Title, Subtitle and Footnote and Show or Hide details.
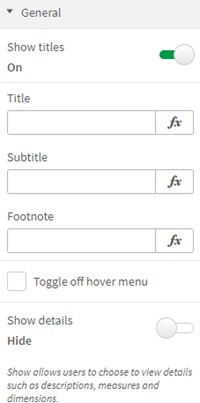
Figure 1: General
Links Styling
Links Styling (Figure 2) contains settings for styling the links in the sankey chart. With Link colors, there are options to choose a solid or blend-in Color mode (inheriting the colors of connecting nodes and blending them together), and set the Link Opacity. With Link value Labels you can choose to display a label, set the Link Label Font Color, Links Label Font Size, Links Label Font Style and Links Label Position.
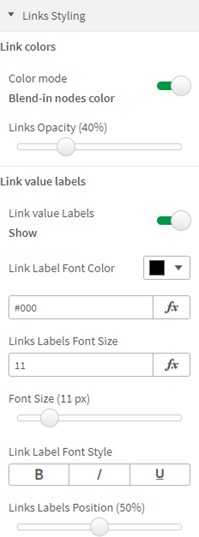
Figure 2: Links Styling
Nodes Styling
Nodes Styling (Figure 3) allows you to apply styling to the nodes in the sankey chart, setting the Nodes Width and Distance between nodes in Nodes Styling.
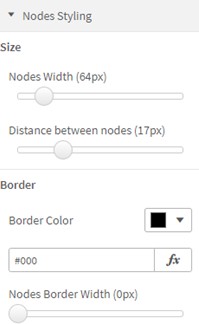
Figure 3: Nodes Styling
With Labels (Figure 4) you can set the Node Label Orientation, Node Label Font Color and Node Label Font Size, choose to display the Label inside the node and Prevent Labels overlapping. You can also choose to enable a Node Label Length Limit.

Figure 4: Labels
With Values (Figure 5) you can set the Node Value Orientation, Node Value Font Color, Node Value Font Size, Node Value Font Style and set the Value inside the node.
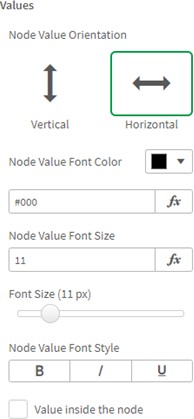
Figure 5: Values
Colors
There are two option for applying Colors to the sankey chart, with Color by Node (Figure 6) you can choose a Coloring Type (Classes color each node distinctly, gradient colors the node based on measure value and sequential colors the nodes on a pre-defined range). You can also choose to Use Custom Colors and enter HEX color codes, and also choose to Reverse Colors and invert the color scheme.
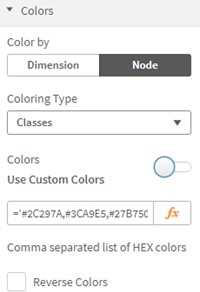
Figure 6: Color by Node
When you choose Color by Dimension (Figure 7), you can choose to Use Color Scheme or enter a custom list using HEX color codes, and select Reverse Colors to invert the color scheme.

Figure 7: Color by Dimension
Dimension Titles
When you choose to enable Dimension Titles (Figure 8), you can set the Position, choose a Font Color, Font Size, Font Style and set a Background Color and Background opacity, you can also choose to enable Show alternative count and Show drilldown breadcrumbs.

Figure 8: Dimension Titles
Measure Title
When you enable Measure Title (Figure 9), you can set the measure Position, and choose the Font Color, Font Size, Font Style, a Background Color, Background Opacity, and enable Show alternative count.
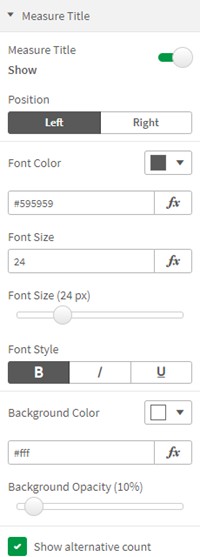
Figure 9: Measure Title
Font Settings
Font Settings (Figure 10) allow you to choose a Font Family for the sankey chart.
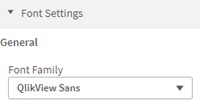
Figure 10: Font Settings