Properties - Dimensions, Measures, Sorting, Data Handling
Vizlib Sankey Chart supports one measure with multiple dimensions. In the Data section, you can add dimensions or metrics dynamically and decide whether they should be used directly or added as alternative dimensions, which can be selected when you're in analysis mode.
This topic contains the following sections:
Dimensions
When you add a dimension (Figure 1), you can choose to Include null values, and set a Limitation on your chart data, choosing from a Fixed number (e.g. the top 10 values), the Exact value, or a Relative value (e.g. only showing values above 50%). Show (Always / Conditional) gives you the ability to specify a conditional expression which shows or hides the dimension in the Sankey chart. Node Color specifies a color for the dimension, and you can also specify the color using a HEX code in a Qlik expression. You can also display the dimension label by enabling Node Label and display the measure value for the dimension nodes with Node Value.
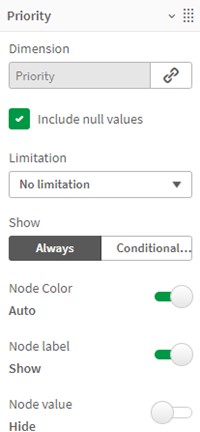
Figure 1: Dimensions
Group Nodes (Figure 2) enables grouping to join multiple dimension values into groups.
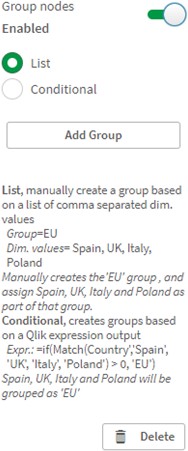
Figure 2: Group Nodes
Measures
When you add a measure (Figure 3), there's a setting to enable Master measure formatting, which means formatting for the measure will be taken from the master item definition (you can find master items in the Custom Objects menu in the left hand panel). You can also choose to Use custom Pattern, select a Number formatting option, and enable Use currency to add currency formatting.
Note: Master measure formatting is not displayed for measures created using the Fields list.
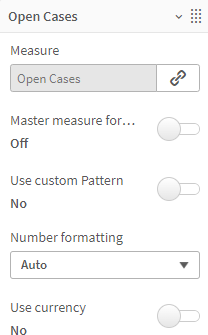
Figure 3: Measures
Sorting
The Sorting settings (Figure 4) allows you to enable a General sort by node size, and set it in Ascending or Descending order.
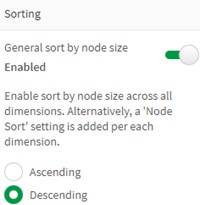
Figure 4: Sorting
Data Handling
With Data Handling settings (Figure 5), you can set a Sankey Nodes Limit specifying the Max Nodes Per One Dimension, and set a Data Downloading limit (by default, this is limited to the first 5000 rows). You can also choose to Suppress Zero Values and set a Calculation Condition to display the chart if a condition is met.
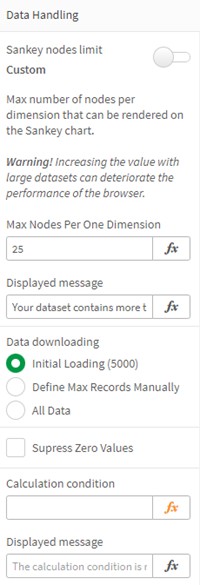
Figure 5: Data Handling