Setup Wizard
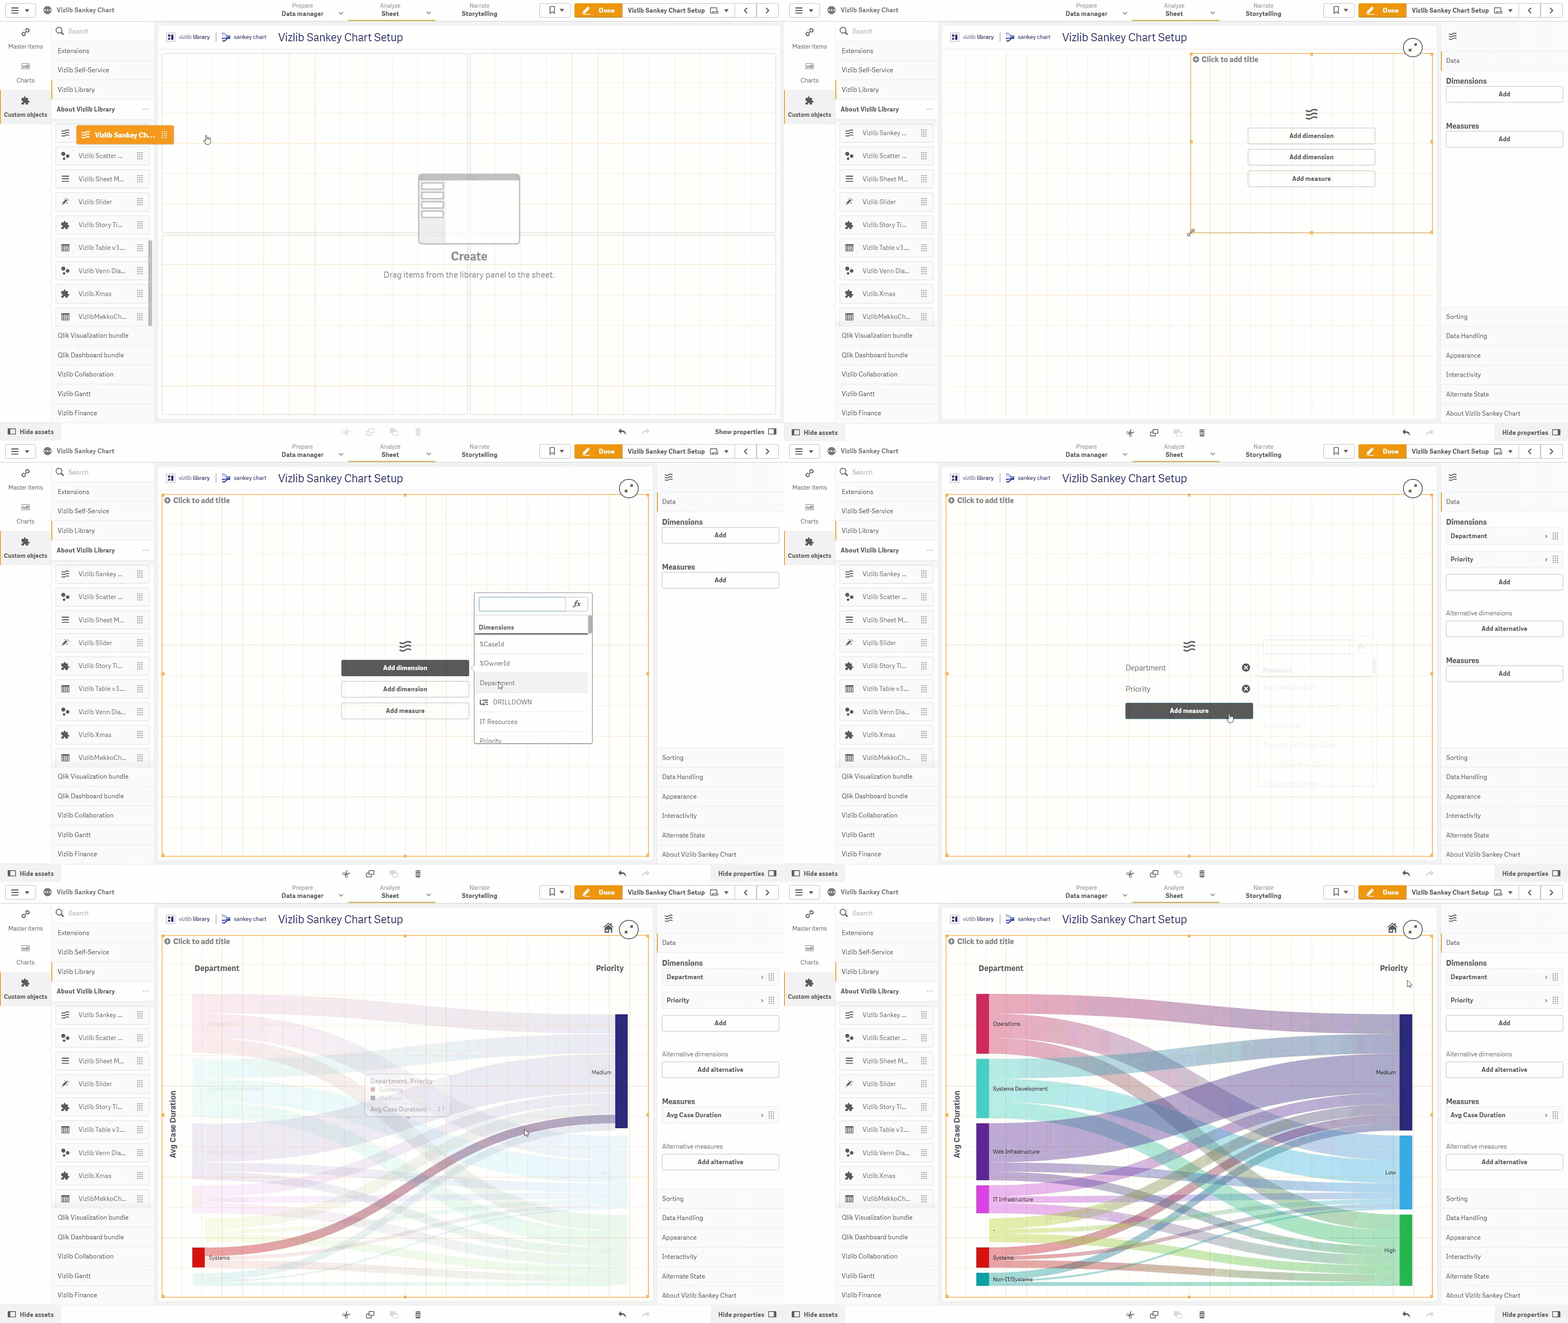
Vizlib Sankey Chart has a Setup Wizard, which quickly and easily helps you to create a visualization (Figure 1).
This topic contains the following sections:
Setup Guide
It's activated when you add a Vizlib Sankey Chart object from the Custom Objects menu to a sheet. The example here shows a breakdown of the average case duration for each department channelled according to priority level.

Figure 1: Setup Example
If you want to use the Setup Wizard, follow these instructions:
-
Click on Custom Objects in the far-left panel, to open the custom objects menu.
-
Select Vizlib Library.
-
Click and hold the cursor on Vizlib Sankey Chart.
-
Drag and drop the cursor into the sheet.
-
Drag the table edge (highlighted in orange) to change the table size.
-
Click Add dimension and select a value from the list to add your dimensions.
-
Click Add measure and select a value from the list to add your measure.
-
Once you've added the measure and dimensions, the chart will be created automatically.
Property Panel Updates
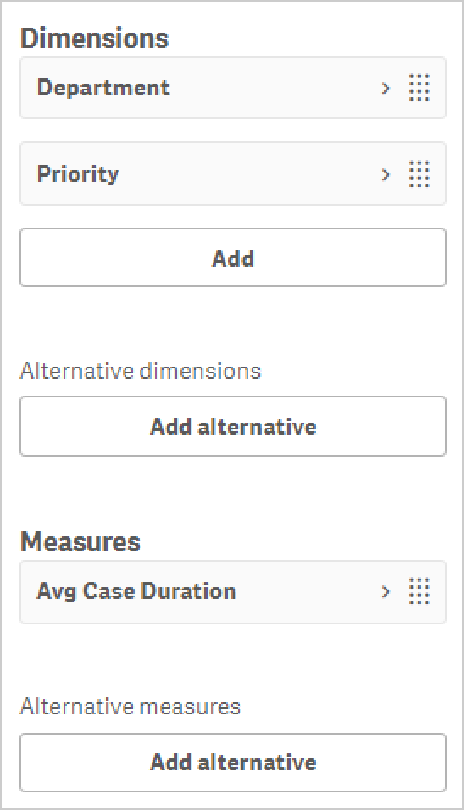
You can edit the field settings in the Data section in the property panel (Figure 2), clicking Add alternative if you'd like to adapt the chart and show different values.

Figure 2: Sankey Chart Data