Advanced Analytics: Clustering
Vizlib Scatter Chart includes a number of algorithms for Clustering data points and recognize patterns in your data set.
This topic contains the following sections:
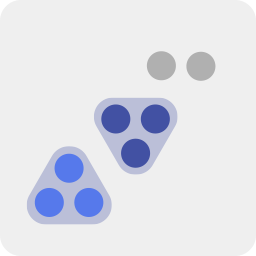
What is a Cluster?
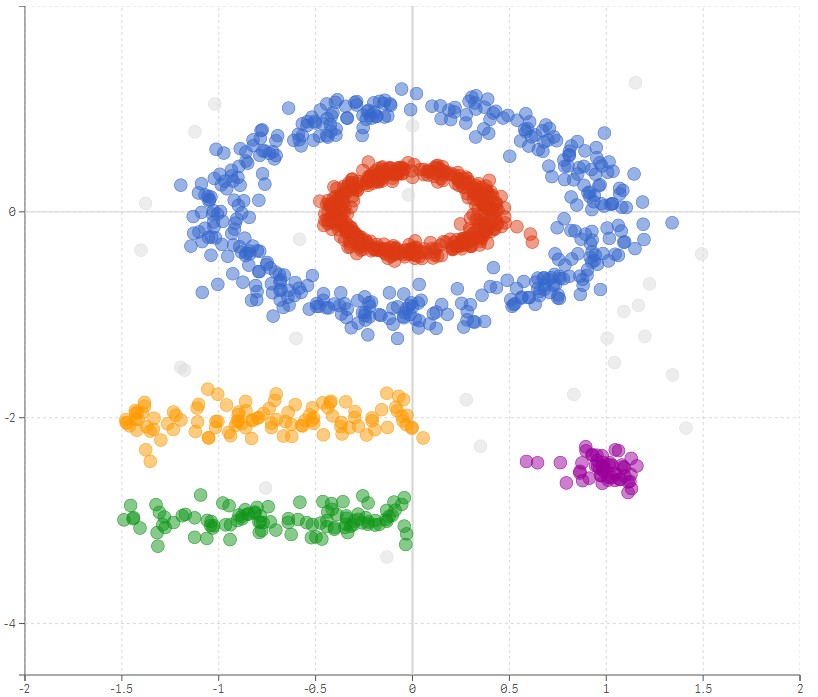
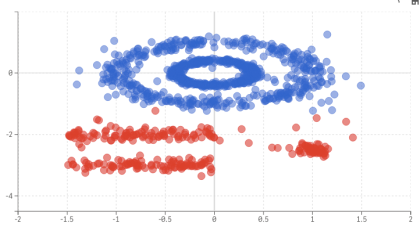
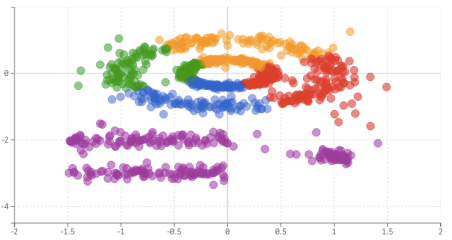
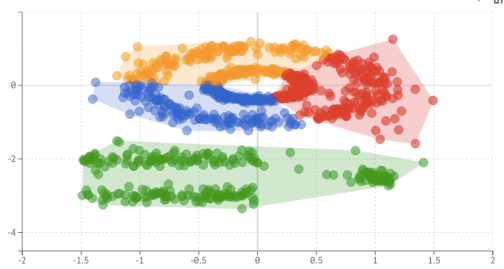
A cluster refers to a collection of data points aggregated together because of certain similarities. In the image below, you can see clear groups that have been defined by our algorithm, creating five well-defined clusters based on shared similarities.
Why Use Clustering?
For the majority of businesses, clustering can provide immediate benefits. Some of the use cases are below:
-
Behavioral segmentation
-
Segment customers by purchase history.
-
Segment customers by online activities. Define personas based on interests.
-
Create profiles based on activity monitoring.
-
-
Inventory categorization
-
Group inventory by sales activities.
-
Group inventory by production metrics.
-
-
Understanding IoT and personal devices data
-
Detect activity types in motion sensors.
-
Group images.
-
Separate audio from recordings.
-
Identify groups in health monitoring.
-
-
Detecting bots and/or anomalies
-
Separate valid activity groups from bots.
-
Group valid activity to speed up outlier detection.
-
Advanced Analytics: Vizlib Line Forecasting
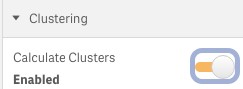 Enable Clustering calculation.
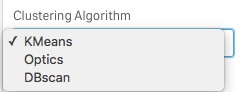 Choose one of the Clustering algorithms.
K-Means
K-means clustering is a form of unsupervised learning that is used when unlabeled data (i.e. data without specified categories or groups) is used. The aim of this algorithm is to discover groups and patterns in the data, with variable K representing the amount of groups. The algorithm operates to assign each cluster iteratively. The aim of this algorithm is to discover groups within the data, with the amount of groups represented by the variable K.
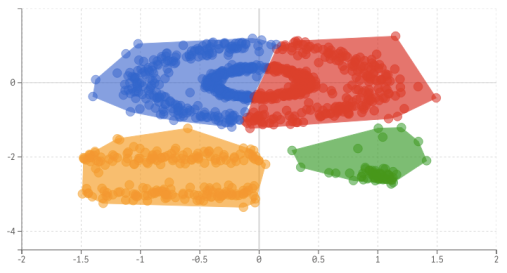
Given the lower level of complexity in the K-Means algorithm, we include an option here to surround and highlight the area of the clusters. K-Means uses random centroids, which means that each time it is run (typically for larger clusters), this may produce a different set of clusters.
|
|
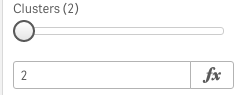
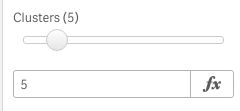
Define the number of clusters. |
|
|
|
|
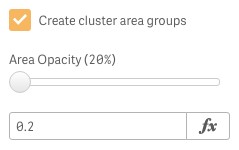
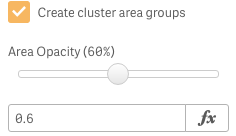
Enable the function of grouping clusters and set the opacity of the groups. |
|
|
DBSCAN
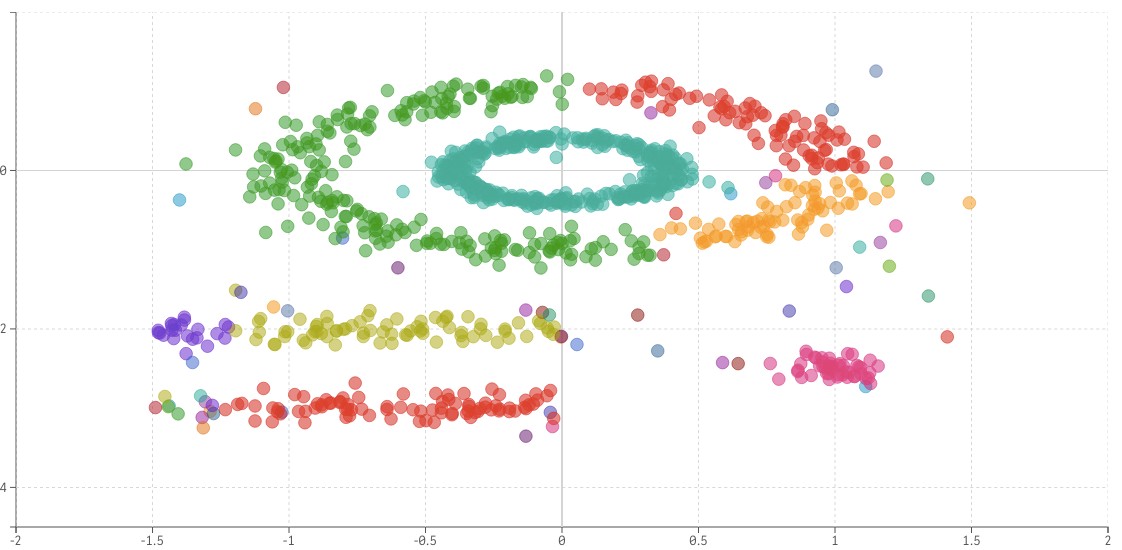
Density-based spatial clustering of applications with noise (DBSCAN) based on density is a well-known data clustering algorithm widely used in data mining and machine learning. DBSCAN groups points that are near to each other based on a range measurement and a minimum amount of points based on a set of points. It also marks the points in low-density areas as outliers.
There are two parameters in DBSCAN:
Minimum number of points
The minimum number of points to form a dense region. For example, if we set the minPoints parameter as 5, then we need at least 5 points to form a dense region.
Distance between points
Specifies how close points should be to each other to be considered a part of a cluster. It means that if the distance between two points is lower or equal to this value (eps), these points are considered neighbours.
OPTICS
Ordering points to identify the clustering structure (OPTICS) is an algorithm for clustering data similar to DBSCAN. The main difference between OPTICS and DBSCAN is that it can handle data of varying densities. Clustering returned by OPTICS is nearly indistinguishable from a clustering created by DBSCAN.