Properties - Appearance
The Appearance tab manages settings relating to the look and feel of your Vizlib Scatter Chart.
This topic contains the following sections:
General
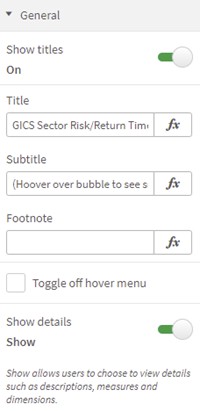
In the General tab (Figure 1), you can choose to show or hide a Title, add a Subtitle or Footnote using the expression editors and enable Show details to display details for chart values.

Figure 1: General
Dimension
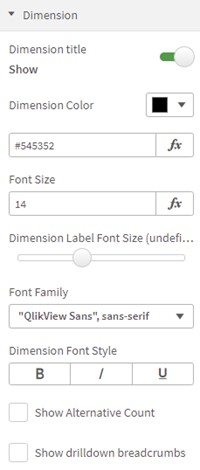
In the Dimension settings (Figure 2), you can show the Dimension title, set the Dimension color, choose the Font Size, select a Font Family, and a Dimension Font Style. You can also enable alternative dimensions with Show Alternative Count and Show drilldown breadcrumbs.

Figure 2: Dimension
X-Axis
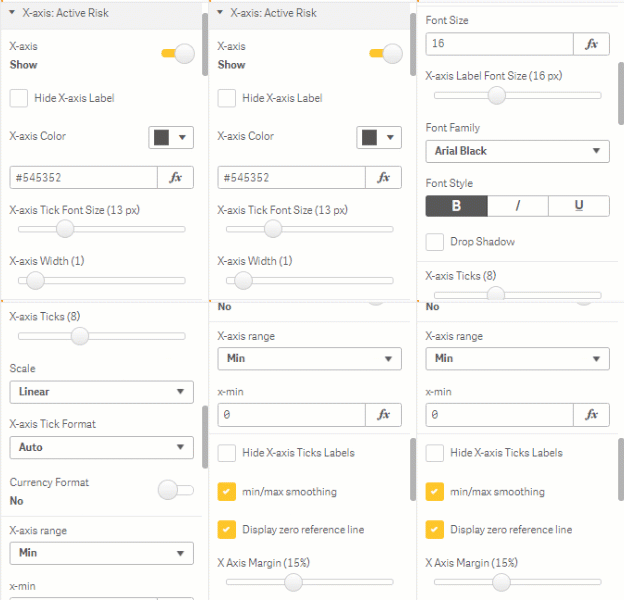
X-axis settings (Figure 3) allow you to make changes to the way the x-axis in the scatter chart is displayed.

Figure 3: X-Axis
In the X-axis settings, you enable the axis display with Show/Hide, hide the axis label with Hide X-axis label, set the X-axis Color, set the X-axis Tick Font Size (the measurement scale the axis uses), and control axis line thickness with Axis Width.
The Label settings allow you to set the X-axis Label Font Size, choose a Font Family, a Font Style, and select Drop Shadow to apply a text shadow effect.
You can use X-axis Ticks to control the number of ticks the axis displays, choose between a linear or logarithmic Scale, control the tick values' numeric display with X-axis Tick Format and enable a Currency Format to set a currency symbol position.
X-axis range controls the calculation of the range for metrics values, either automatically or entering a minimum or maximum value.
You can also choose to Hide X-axis Tick Labels, enable min/max smoothing to ensure the axis begins and ends with an appropriate rounded integer value, and choose Display zero reference line to show a zero value. X-Axis Margin controls the scatter chart margin, increasing or decreasing the amount of empty space around the edges of the chart (margins are not available for a Min/Max X-axis range).
Y-Axis
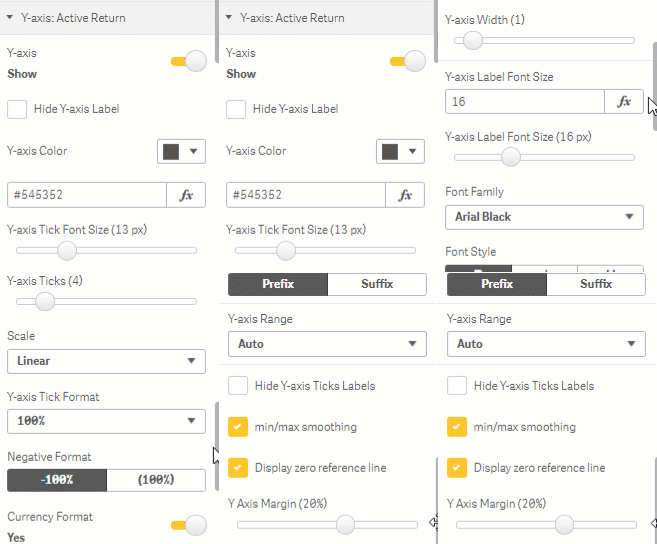
Y-axis settings (Figure 4) allow you to make changes to the way the y-axis in the scatter chart is displayed.

Figure 4: Y-axis
In the Y-axis settings, you enable the axis display with Show/Hide, hide the axis label with Hide Y-axis label, set the Y-axis Color, set the Y-axis Tick Font Size (the measurement scale the axis uses), and control axis line thickness with Y-axis Width.
The Label settings allow you to set the Y-axis Label Font Size, choose a Font Family, a Font Style, and select Drop Shadow to apply a text shadow effect.
You can use Y-axis Ticks to control the number of ticks the axis displays, choose between a linear or logarithmic Scale, control the tick values' numeric display with Y-axis Tick Format and enable a Currency Format to set a currency symbol position.
Y-axis range controls the calculation of the range for metrics values, either automatically or entering a minimum or maximum value.
You can also choose to Hide Y-axis Tick Labels, enable min/max smoothing to ensure the axis begins and ends with an appropriate rounded integer value, and choose Display zero reference line to show a zero value. Y-Axis Margin controls the scatter chart margin, increasing or decreasing the amount of empty space around the edges of the chart (margins are not available for a Min/Max Y-axis range).