Properties - Interactivity and Alternate State
This topic contains the following sections:
Interactivity
The Interactivity tab enables the users to interact with chart data and navigate across the scatter chart for a better view of the data points.
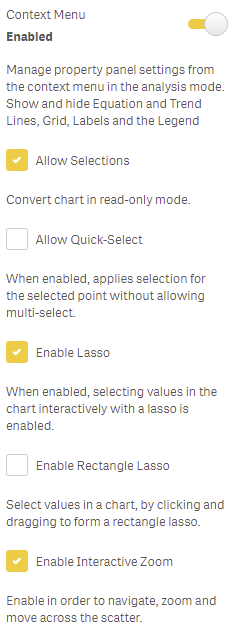
Context Menu (Figure 1) allows you to show (or hide) a Trend Line, Equation, Labels, a Legend, a Grid, Advanced Analytics and a Clusters Area. Allow Selections gives the user the ability to select the bubbles in the chart in order to pass selections back to the app. Allow Quick Select circumvents the selection confirmation steps and initiates the selections right away. Quick select suppresses the ability to multi-select, but that's where the lasso can be utilised. Enable Lasso allows users to draw a lasso circle with the mouse to interactively select multiple bubbles in one go. Enable Lasso Rectangle allows users to draw a lasso rectangle with the mouse to interactively select multiple bubbles at once.
Note: To use the lasso and lasso rectangle, click and drag an area of the chart, or, when interactive zooming is enabled, select the lasso button at the top right-hand corner.
Enable Interactive Zoom allows the user to navigate and to zoom in/out throughout the scatter chart to create a better view of the plotted data points.

Figure 1: Context Menu, Allow Selections, Allow Quick-Select, Enable Lasso, Enable Rectangle Lasso, Enable Interactive Zoom
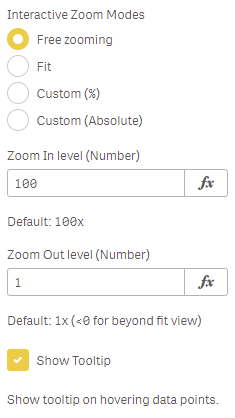
Interactive Zoom Modes (Figure 2) sets the number for the zoom level (Zoom in and Zoom out) from a choice of Free zooming, Fit, Custom% and Custom absolute. Show Tooltip activates the tooltip functionality which displays information about the bubble data point hovered over.

Figure 2: Interactive Zoom Modes, Show Tooltip
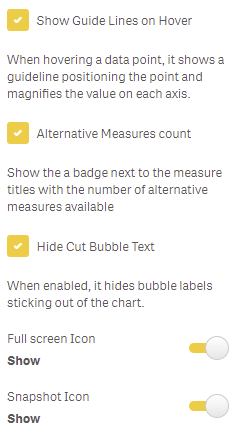
Enabling Show Guide Lines on Hover (Figure 3) positions the points and magnifies the value on each axis when the cursor is held at that location. Alternative Measures count shows the badge next to the measure titles with the number of alternative measures available. Hide Cut Bubble Text hides bubble labels sticking out of the chart. Full screen Icon allows users to maximize and minimize objects. Snapshot Icon allows users to take snapshots of the object.
Note: Snapshot icon has been part of the Hover Menu since the Qlik Sense September 2020 release, and is no longer controlled using the property panel.

Figure 3: Show Guidelines on Hover, Alternative Measures Count, Hide Cut Bubble Text, Full Screen Icon, Snapshot Icon
Alternate State
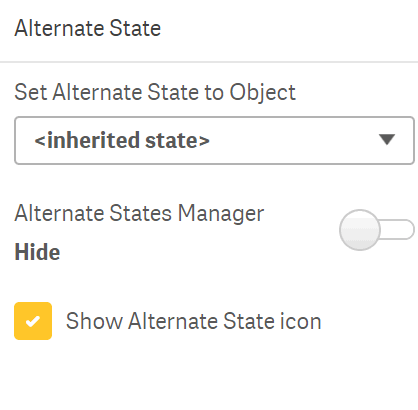
Alternate State permits you to assign the Vizlib Scatter Chart to an alternate selection state (Figure 4). You can find more information on alternate states here.

Figure 4: Alternate State