Setup
Vizlib Scatter Chart has a quick and easy Setup process, this article shows an example to help you create a visualization quickly and easily.
This topic contains the following sections:
Setup
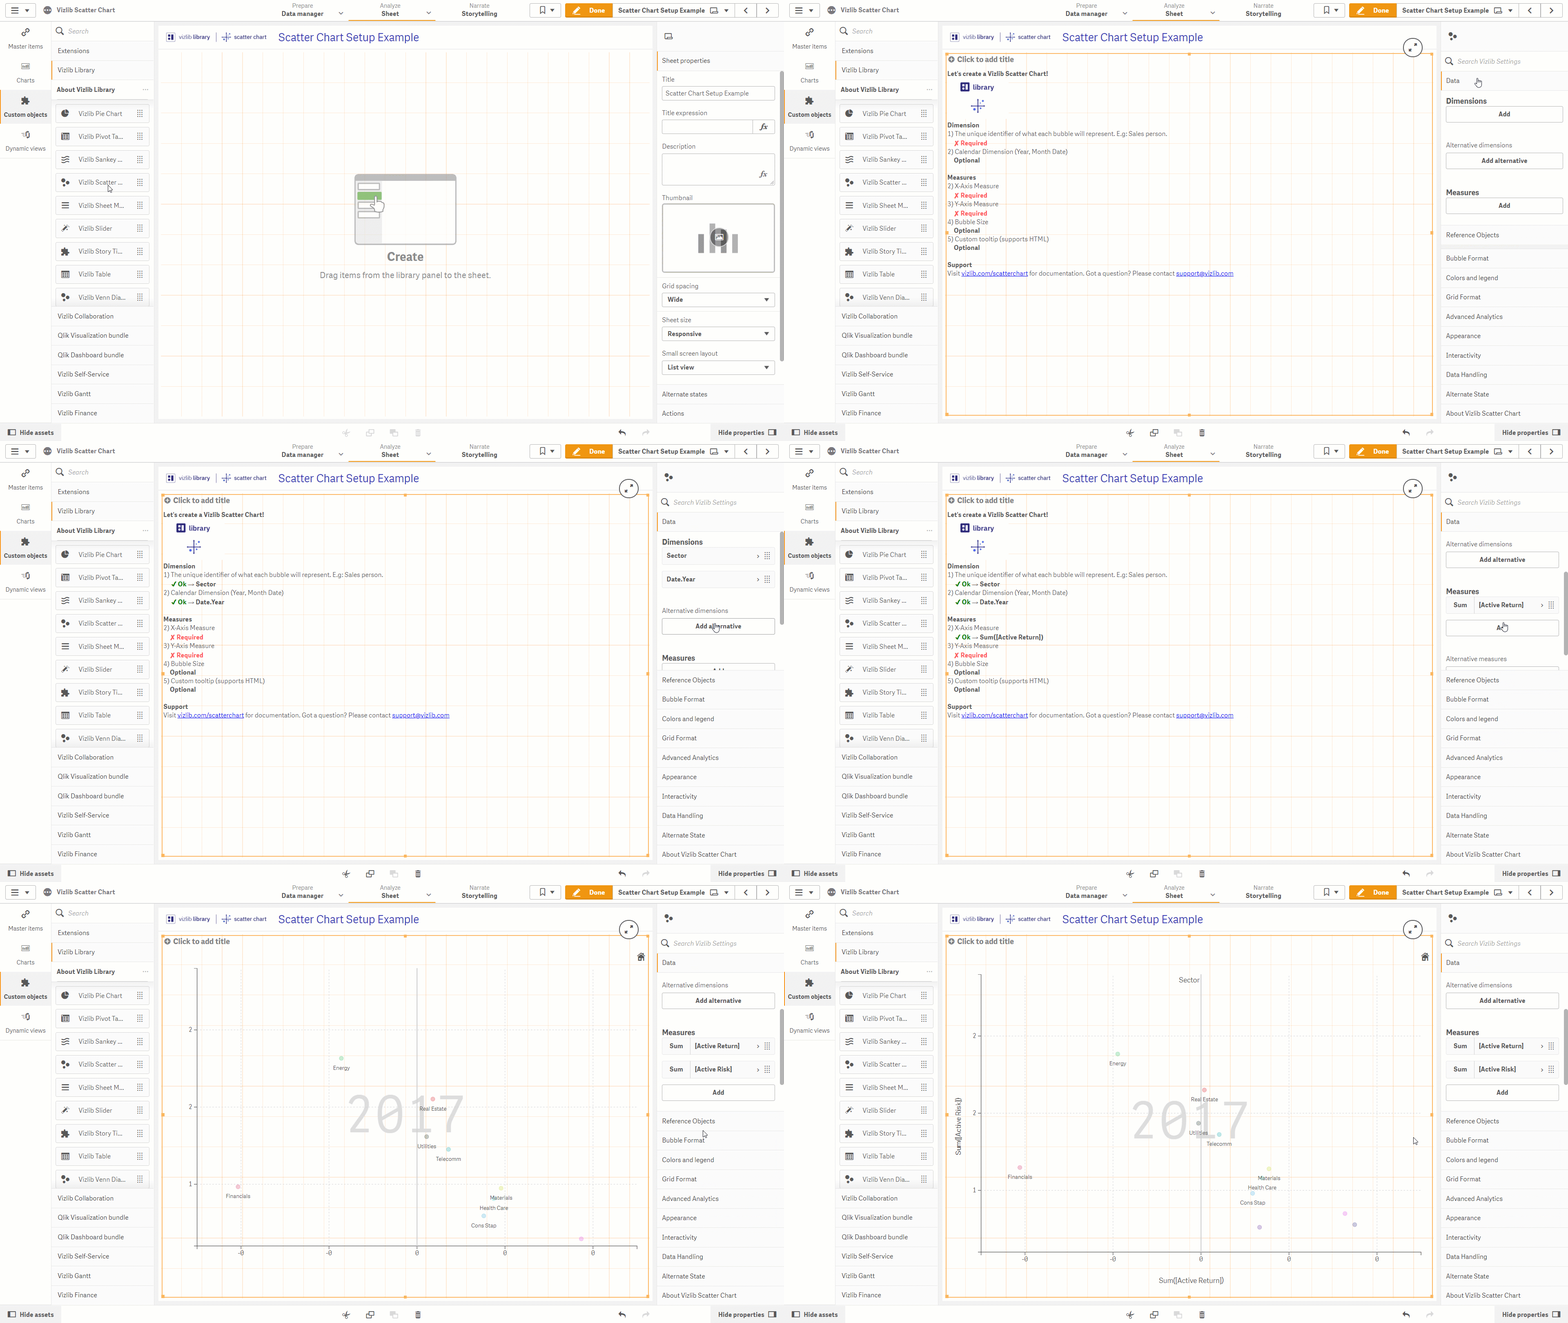
Setup is activated when you add a Vizlib Scatter Chart object from the Custom Objects menu to a sheet (Figure 1).

Figure 1: Setup
To complete the setup, follow these instructions:
-
Click on Custom Objects in the far-left panel, to open the custom objects menu.
-
Select Vizlib Scatter Chart.
-
Click and hold the cursor on Vizlib Scatter Chart.
-
Drag and drop the object into the sheet. You can drag the edges to change the size.
-
You'll see a list of steps on the left of the sheet. A tick will appear beside each step when you complete them.
-
Select your Dimensions in the property panel.
-
Select your Measures in the property panel.
-
Your scatter chart should be displayed now. You can change the Bubble Size and add Custom Tooltip now, or add them later in the property panel.
-
When you've added your changes, click on Done to close edit mode.
Edit Setup Properties
Once you've finished setup, you can edit the Vizlib Scatter Chart settings in the property panel, you can find more information about the property panel in the Properties articles, which are listed in the Introduction.