Properties - Appearance
In the Appearance section you can customize the settings which control the look and feel of your Vizlib Table object.
This topic contains the following sections:
General
In General settings (Figure 1) you can add a Title, Subtitle and Footnote, you can also set the Show details mode, which allows users to view information about descriptions, measures and dimensions.
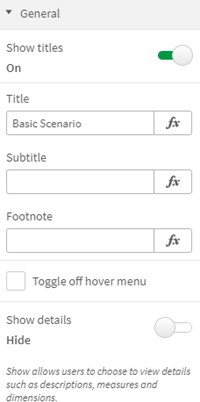
Figure 1: General
Master Colors
With the Master Colors settings (Figure 2), you can choose the Master Mini Chart Color, Master Progress Bar Color and Master Font Color, either by using the color picker or entering an expression.
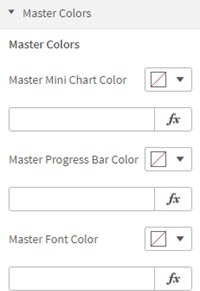
Figure 2: Master Colors
Header
In the Header settings (Figure 3), you can choose to show or hide the Header row, set the Header Font Size, Font Family, Font Style, add a Drop shadow, and choose the Horizontal Alignment.
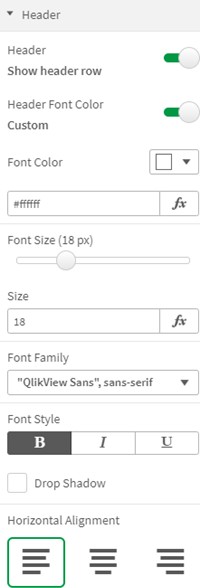
Figure 3: Header Settings
You can also change the Background color (Figure 4), show the Header Borders, choose the Borders Style and Color, define the Borders Thickness, enable/disable the Borders Selector. The Important Style setting will overwrite every style connected with the header border when it's selected.
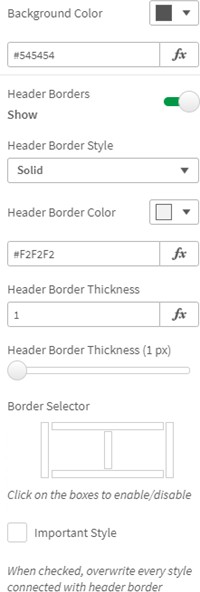
Figure 4: Header Borders
Rows
The Rows settings (Figure 5) allow you to set the table Row Height, Font Size, Font Family, Font Style, and add a Drop Shadow.
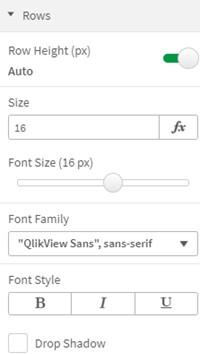
Figure 5: Rows
You can also customize a row Background, choosing a Background Color, showing or hiding the Row Borders, and setting the Row Border Style, Row Border Color, and Row Border Thickness (Figure 6).
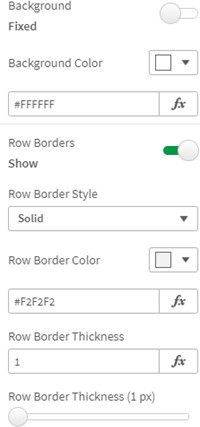
Figure 6: Row Background, Borders
Totals
The Totals settings (Figure 7) allow you to display totals with Show Totals Row, allow a representation Indicator in totals to be displayed, set the Total Row Height and Font Size, add a Totals Label, set the Font Color, Background.
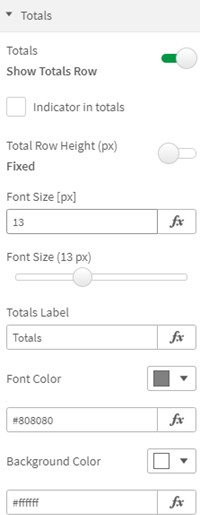
Figure 7: Totals
You can also set the totals Position, define the Total Borders, set the Total Borders Style, Color, and Thickness, and enable or disable borders with the Border Selector (Figure 8).
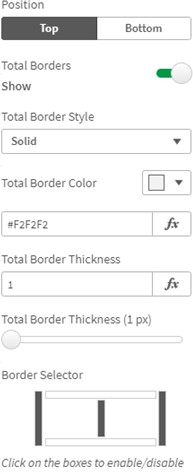
Figure 8: Totals Borders