Properties - Interactivity
Interactivity enables the users to interact with the data in the chart as well as navigate throughout the scatter view for a better view of the chart.
This topic contains the following sections:
Allow Selections
Enabling Context Menu lets you merge cells, manage totals and copy a cell value when the table is in Analysis mode, Allow Selections (Figure 1) gives the user the ability to select the bubbles in the chart to pass selections back to the app, and Allow Measure Selection lets them link measures to related dimensions. You can also choose to Enable Multiselect, Enable Drag Select and allow Column Resizing.
Figure 1: Allow Selections
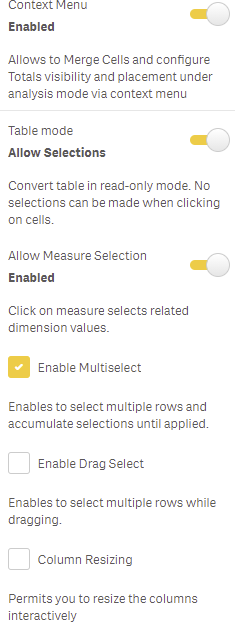
Note: If you enable Allow Measure Selection you won't be able to use Vizlib Actions with measures, and if you choose Enable Multiselect you won't be able to use Vizlib Actions with dimensions.
Interactive Sorting
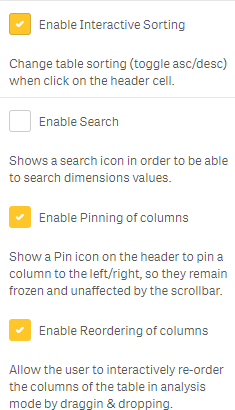
When you enable Interactive Sorting (Figure 2), you can change the sort order by clicking on the header cell. You can also Enable Search to show a search icon, Enable Pinning of columns to show an icon to pin a column to the left or right, and Enable reordering of columns lets you use drag and drop to re-order the table.
Note: Updating pinned columns is not supported when using master objects.
Figure 2: Enable Interactive Sorting
Formatted Export Settings
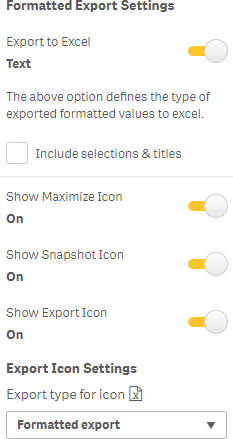
You can choose how you Export to Excel with Formatted Export Settings (text or values), and Include selections and titles. Exporting Text will allow you to download a basic version of the document, exporting Values will download a file containing all your visual changes (border colors, font sizes and links). You can choose Show Maximise Icon to allow objects to be maximized, and Show Snapshot Icon to have the ability to take snapshots of this object. If you choose Show Export Icon you can also choose the Export Icon Settings (either formatted or a straight table).
Note: Snapshot icon has been part of the Hover Menu since the Qlik Sense September 2020 release, and is no longer controlled using the property panel.
Figure 3: Formatted Export Settings
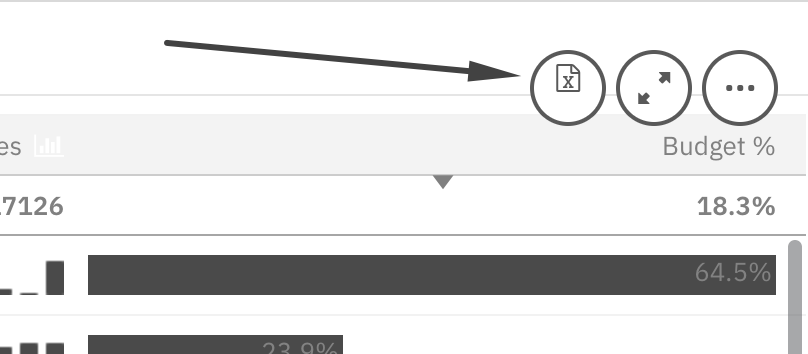
Note: The Vizlib Table quick export function respects your security rules (as of v3.21.1 ) so if your users have export restrictions, the Quick Export option (Figure 4) will respect these rules.
Figure 4: Quick Export
Enable or Disable Formatted Export
You can enable or disable the formatted export using the Allow formatted export option in the Property Panel > Interactivity > Formatted export settings
Figure 5: The Allow formatted export option in the Property Panel
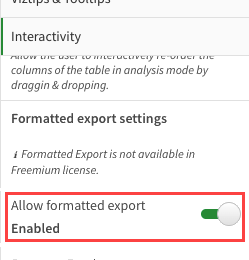
When the Allow formatted export option is Disabled, all formatted export options are unavailable. The end users can't export formatted data.
Vizlib Table Download Options
When you've finished editing Vizlib Table, you can download the visualized data either as a PDF or Image, or you can choose one of the following export options:
-
Export Data to Excel
-
Export Formatted Data to Excel
-
Export Data to CSV
-
Export Data to Tab Separated CSV
The download and export options are available when you right-click the application and choose the Download As... option.
Figure 6: The Download as... option on the user interface
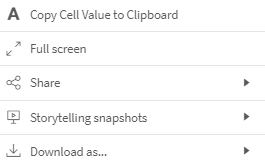
Figure 7: Download and export options available after selecting the Download as... option
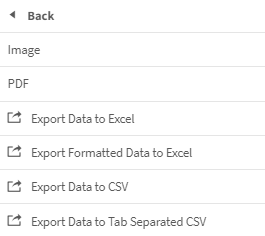
Note: The Download as... option isn't available if you're editing the application.
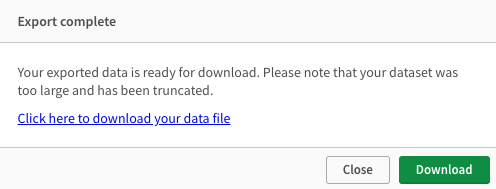
Due to Qlik limitations for .csv and .xslx export, some data may be missing in the exported file. Whenever your data exceeds Qlik limits, the following messages appear.
Figure 8: Message informing about exceeded limit
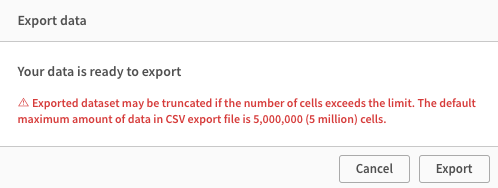
Figure 9: Message after export is complete
To learn more about Qlik limits for exporting data to .csv or .xslx, click here.