Properties - Viztips and Tooltips
The Viztips and Tooltips settings help you to manage tooltips in Vizlib Table, and you can also enable Viztips to add dynamic tooltips. If you'd like to find out more about Viztips, you can find our overview article here.
This topic contains the following sections:
Viztips and Tooltips
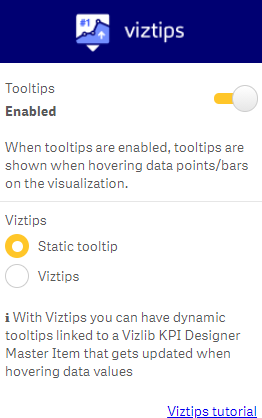
To display Tooltips, you need to move the slider to Enabled, and then you can select the Viztips option (Figure 1) to start working with dynamic tooltips. There's also a link to the Viztips tutorial if you need to check anything.

Figure 1: Viztips and Tooltips
Viztips Content
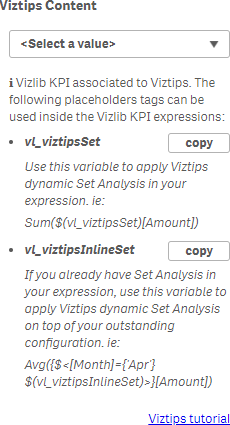
Viztips Content settings contain a drop-down where you select the master item, and includes a copy function for Viztips placeholder tags and a further link to the tutorial (Figure 2).

Figure 2: Viztips Content
Viztips Settings
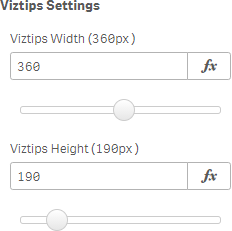
With Viztips Settings (Figure 3) you can use the sliders to change the height and width of the Viztips object in the chart.

Figure 3: Viztips Settings