Properties - Appearance
Appearance settings help you control the look and feel of your Vizlib Venn Diagram.
This topic contains the following sections:
General
In the General section (Figure 1), you can add a Title, Subtitle and Footnote to your Vizlib Venn Diagram.
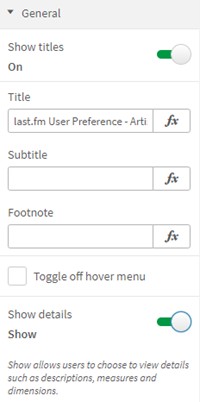
Figure 1: General
Labels
The first group of settings in the Labels section are Dimension Labels (Figure 2), where you can set the Dimension Font Size, the Dim label Font Color and the Dimension Font Style.
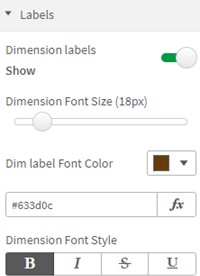
Figure 2: Dimension Labels
Measure values (Figure 3) allow you to set the Measure Font Size, Measure Font Color, apply a Measure Format using the drop-down, enable a Currency Format and set the Measure Font Style.
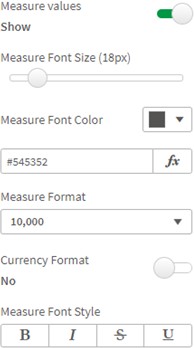
Figure 3: Measure Values
Intersection values settings (Figure 4) allow you to set the Value Font Size, Value Font Color, choose a Value Format, enable a Currency Format and apply a Value Font Style.
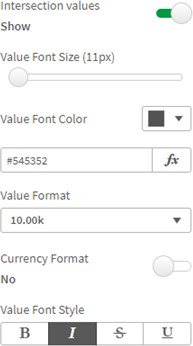
Figure 4: Intersection Values
Colors
You can customize Colors (Figure 5), either by using a pre-defined Scheme or using Custom and entering a list of comma-separated HEX color codes. You can also set the Color Opacity and Reverse Colors to reverse the appearance of the color set.
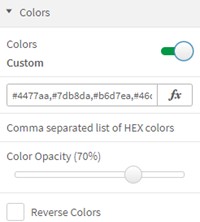
Figure 5: Colors
Circle Formatting
In Circle Formatting (Figure 6), you can choose to Display Circle Borders, set the Border Width and select a Border Color Type.
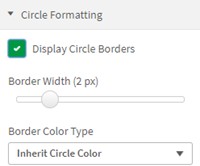
Figure 6: Circle Formatting
Example
The example in Figure 7 shows changes being made to a Vizlib Venn Diagram. First, a Title is displayed, then Labels are add for dimensions, measures and the intersection. A Colors scheme is applied, and the borders are customized using Circle Formatting.
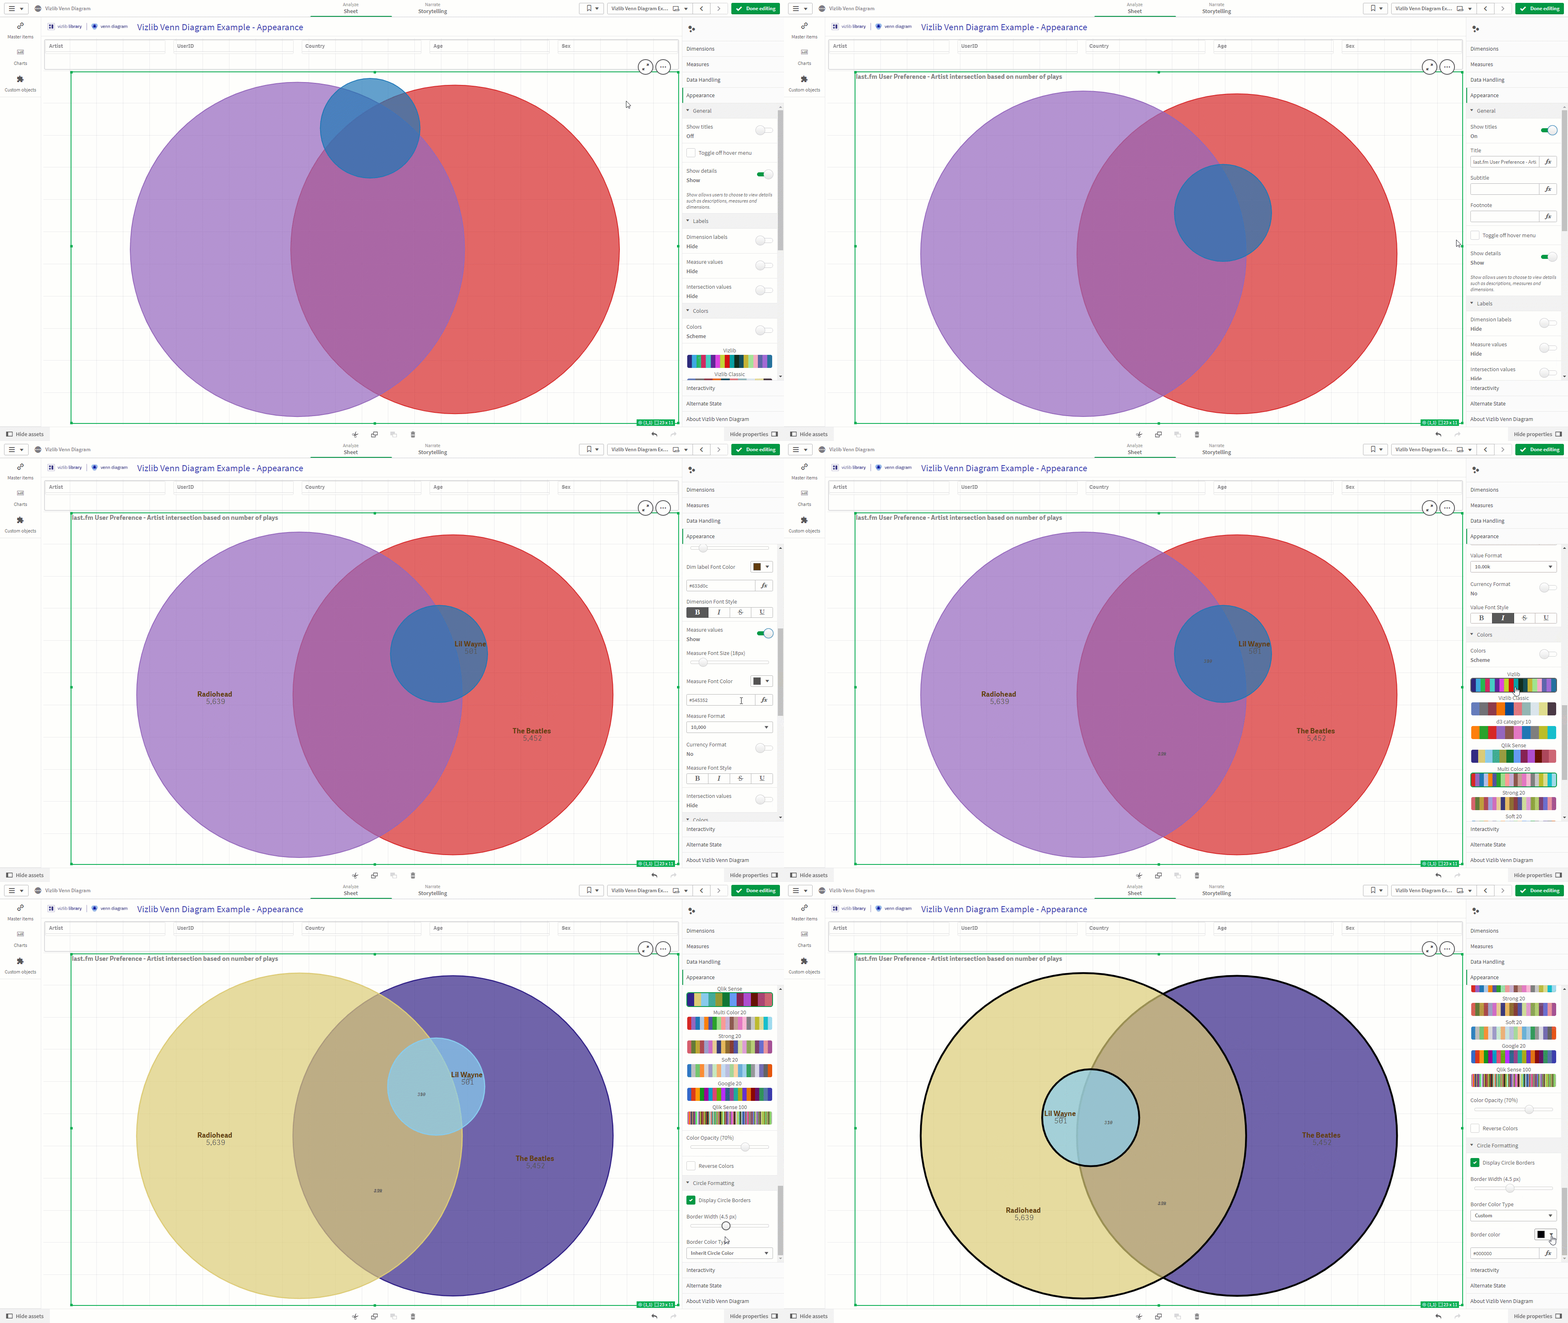
Figure 7: Example