Vizlib Combo Chart Changelog
The following software changes were introduced to Vizlib Combo Chart:
1.15.2
2025-07-10
Resolved Issues
- Resolved the issue where the reference line was not displayed.
Rebranding
-
Rebranded the About Vizlib Combo Chart section of the Property Panel to reflect insightsoftware visual style.
1.15.1
2025-03-20
New Features
- Vizlib Combo Chart supports Cyclic Dimensions. For more information, see Cyclic Dimensions. (VIZ-21838)
1.14.1
2024-01-27
Resolved Issues
- Resolved the issue with missing icons in the Property Panel. (VIZ-21740)
- Resolved the issue with an empty NPrinting report. (VIZ-21805)
1.13.7
2024-11-21
Resolved Issues
- Sometimes the value labels on the chart did not display when the Show All Values checkbox was enabled. The issue occurred if the values were significantly lower compared to rest of the chart. Currently, the labels display properly when the Show All Values checkbox is enabled. (VIZ-21515)
1.13.6
2023-12-04
Resolved Issues
- Combo Chart stability improvements - When using the Vizlib Combo Chart we want to ensure you have full use of the extension, event when in containers. We have improved and extensions stability when inside both Vizlib Container Grid and Qlik Container. (LIB-13364)
1.13.5
2023-10-25
New Features
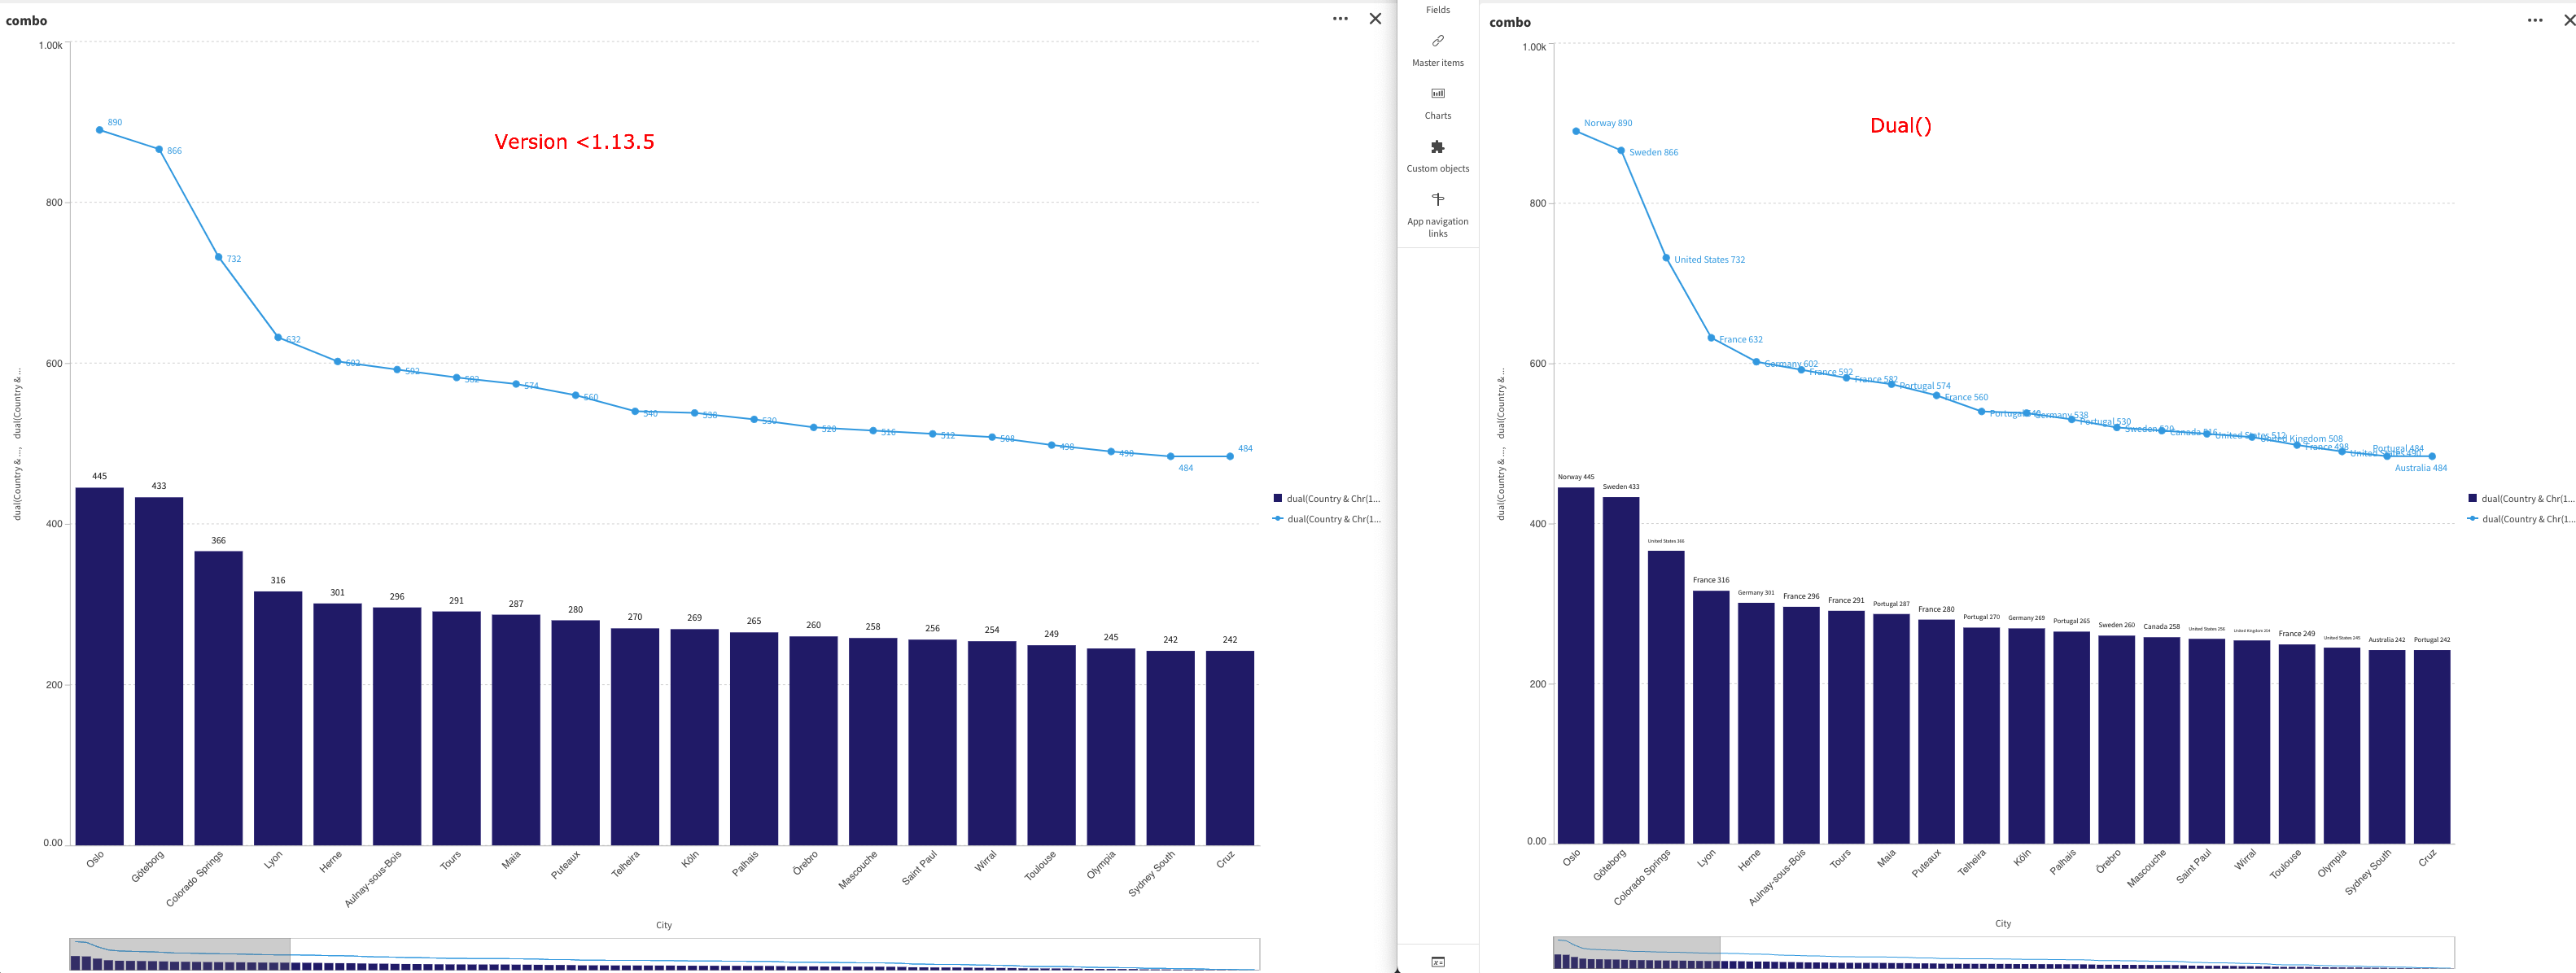
- Make Dual Function available - You are now able to use DUAL() within the Vizlib Combo Chart. Follow the same expression layout you would use for any other chart and insert it into Vizlib Combo Chart's Measures and have a flawless experience with your data analytics. (LIB-11694)
Resolved Issues
- Legend Scroll Button doesn't work in Vizlib Container - When in a Vizlib container as a master item, the legend scroll was not respecting users inputs. (LIB-13235)
1.13.4
2023-08-30
Resolved Issues
- Axis range update for negative data only - Vizlib Combo Charts that only have negative values being displayed would previously display the Y-Axis with positive integers. This update follows the standards set out by Qlik to ensure consistency across your dashboard. (LIB-10190)
Note: This will have a visual impact on charts that only show negative values.
- Tooltip color is inconsistent for lines - When using multiple measures with bars and lines, the color represented by the tooltip would not always match that of the line. (LIB-12996)
- Y-axis showing duplicate tick values - When using Auto format or the Number format with no decimal places, the Y-Axis would display duplicate values. (LIB-13046)
1.13.3
2023-08-04
Resolved Issues
- Console errors appear after set scale type to log - We're dedicated to solving any and all bugs for our products and in this release we have solved a series of error messages for when you change the Scale Type to the Logarithmic (log) setting. (LIB-10632)
1.13.2
2023-05-23
Security updates
- Follow the link below for the latest important security updates for Vizlib Extensions.
1.13.1
2023-05-23
Resolved Issues
- Expression Editor isn't picking up colors - Expression fields were not working for when inputting colors for the Axis from outside the expression window. You are able to type in the HEX or RGB value of a color, for example, without needing to open the expression editor window. (LIB-12615)
1.13.0
2023-04-24
New Features
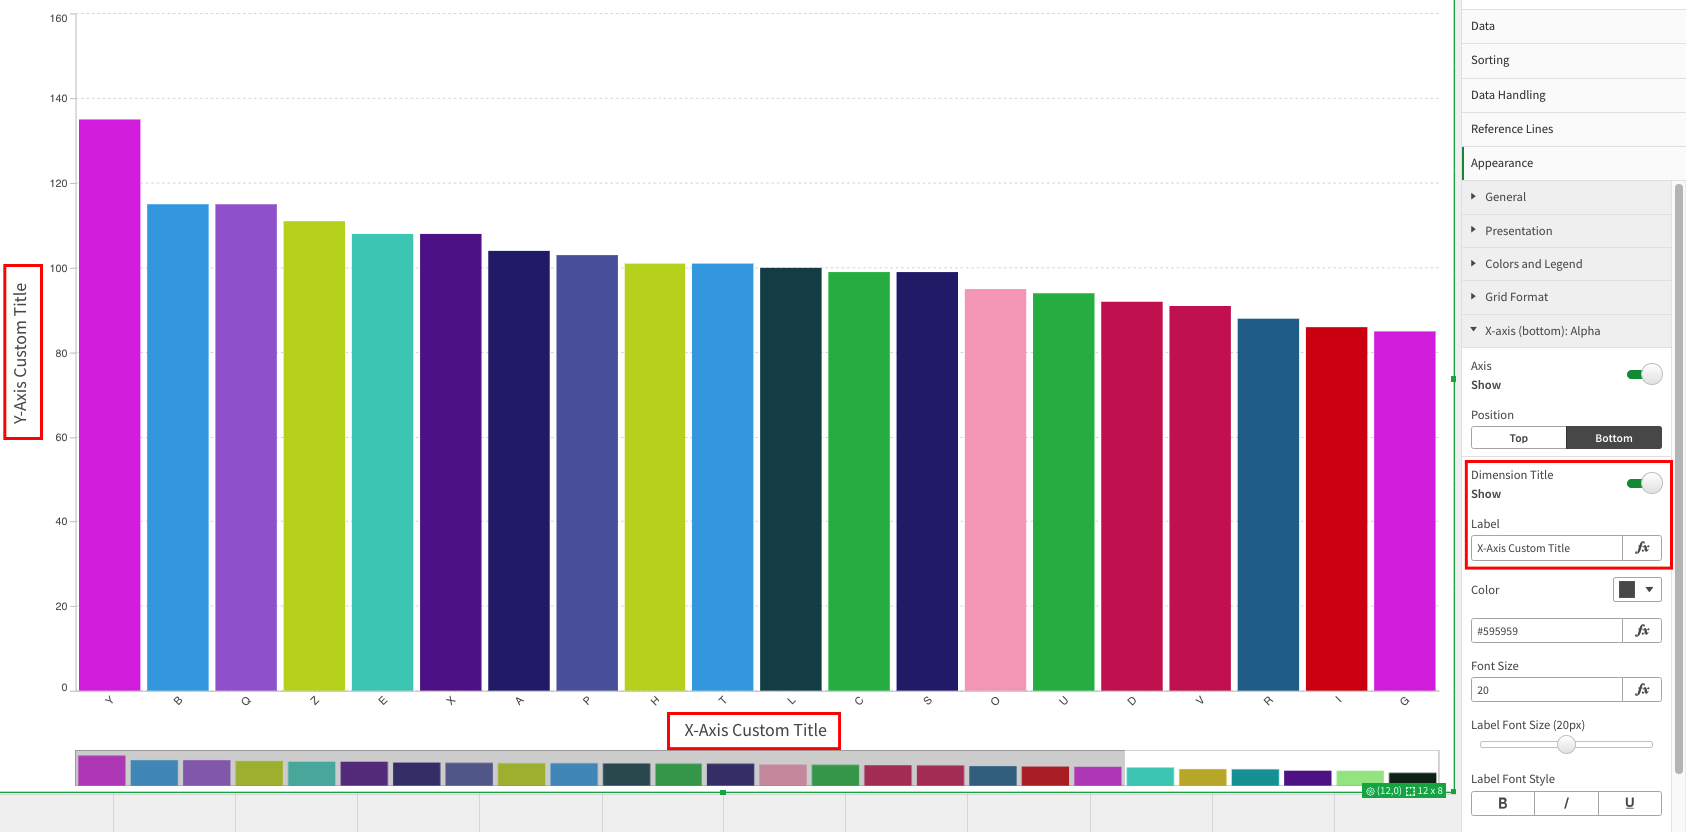
- X & Y-axis Custom Label in Vizlib Combo Chart - You are able to change the name of the X and Y-Axis of the Vizlib Combo Chart in the Property Panel > Appearance > X/Y axis > Dimension Title. (LIB-11603)
1.12.0
2023-03-24
Resolved Issues
- Exporting to PDF switches axis labels - When you had a second axis for the Combo Chart and then export to PDF, the second measure would return as the same label as the first measure. (LIB-12614)
- Page Unresponsive issue on mashup - When having the Data values for the measure enabled for a Bar Chart representation in the Combo Chart extension, the chart in a Mashup becomes unresponsive leading to a 'Page Unresponsive' display. (LIB-11952)
1.11.0
2022-10-12
New Features
- Adding qlik.currApp(this) to the Combo Chart Code. (LIB-11514)
Resolved Issues
- Combo Chart Storytelling - Incomplete chart in the downloaded version. (LIB-9114)
1.10.4
2022-07-13
Resolved Issues
- Bar Type isn't displayed when having data values option set to Show. (LIB-11284)
1.10.3
2022-06-28
Resolved Issues
- License calculation issue. (LIB-11263)
1.10.2
2022-02-04
Resolved Issues
- Custom Axis Display. (LIB-10669)
- Area Series Display. (LIB-10779)
- Duration Format Display. (LIB-10569)
1.10.1
2021-12-13
New Features
- Master Measures Number Formatting. Measures will be displayed with the Master Measures number format automatically. (LIB-9820)
1.10.0
2021-09-29
New Features
- Context Menu Enhancement. New capability that give for end-users more control on charts display, giving the users, the option to adapt the chart display to answer their data questions. (LIB-10128)
- Abbreviation Number Formatting. (LIB-9811)
Resolved Issues
- Axes Area Background Color. (LIB-10126)
1.9.5
2021-08-20
Resolved Issues
- Console Errors. (LIB-9960)
- Display in Qlik Native Container. (LIB-9798)
- Alternate State Setting Section. (LIB-9684)
- Y-Axis Labels Display. (LIB-9585)
- Alternative Dimensions Labels. (LIB-9716)
- Tooltips and Legend Colors. (LIB-9589)
- Chart Scale in Story Mode. (LIB-9101)
1.9.4
2021-07-26
Resolved Issues
- Viztips Console Errors. (LIB-9677)
- Mobile View Errors. (LIB-9656)
- Expression Editor Loading Time. (LIB-9498)
- Tooltip Display. (LIB-9399)
- Number Auto Format Ticks Display. (LIB-9398)
- Secondary Axis Title. (LIB-9252)
1.9.3
2021-04-29
Resolved Issues
- Upgrade to version 1.9.X. (LIB-9140)
1.9.2
2021-04-27
Resolved Issues
- X-Axis Tooltip Display. (LIB-8973)
- Y-Axis Ticks Formatting. (LIB-8889)
- White Spacing in Chart Area. (LIB-8890)
1.9.1
2021-04-12
Resolved Issues
- Data Values Label is Cut Off. (LIB-5267)
- Axis Area Theme Colors Display. (LIB-8700)
- Line Tooltip Display. (LIB-8755)
- Null Data Display. (LIB-8810)
- Labels Styling. (LIB-8957)
1.9.0
2021-03-30
New Features
- Property Panel Search. (LIB-8433)
Resolved Issues
- Grid Lines Display. (LIB-8604)
1.8.1
2021-01-11
Resolved Issues
- Measure Duration Format Display. (LIB-7941)
- Axis Values are Rounded. (LIB-7481)
- Values Message Error on The Chart. (LIB-7849)
- Points Color Display. (LIB-8119)
1.8.0
2020-12-04
New Features
- Viztips support for Master Item Layers. (LIB-7535)
Resolved Issues
- Full Screen Mode. (LIB-7213)
- Alternate Dimension Labels Display. (LIB-6807)
1.7.3
2020-10-01
Resolved Issues
- Y-axis values. (LIB-6720)
- "Invalid visualization error: need to use qlik.currApp". (LIB-6947)
- Threshold Display. (LIB-6612)
1.7.2
2020-09-29
Resolved Issues
- Display format (bar/line/symbol) is not recognized in Legend. (LIB-6496)
- Missing Features in Legend property panel. (LIB-7055)
1.7.1
2020-09-25
Resolved Issues
- Adding a Vizlib Combo Chart master item to Vizlib KPI Designer caused crashing. (LIB-7111)
- Use of conditions impacted the order and relationship of bars to their respective labels. (LIB-6486)
- Console errors appeared in some configurations of Vizlib Combo Chart. (LIB-6894)
- Alternate dimensions affecting line area display. (LIB-6757)
1.7.0
2020-09-21
New Features
- Option to show null values. (LIB-6879)
Resolved Issues
- Bars overlapped when calculation conditions used on measures. (LIB-6362)
- Upgrade issues. (LIB-6377)
- Line data points not centered perfectly. (LIB-6479)
1.6.2
2020-08-06
Resolved Issues
- Show Overlapped data points display only one measure in tooltip. (LIB-4477)
- Bars shifted when one of the measure is not calculated. (LIB-6317)
- Objects with large datasets not exported. (LIB-5042)
1.6.1
2020-05-26
Resolved Issues
- Last bar hidden. (LIB-5919)
1.6.0
2020-05-19
New Features
- Add Master Item color support. (LIB-5287)
1.5.0
2020-05-14
New Features
- Add Support for Viztips. (LIB-5470)
1.4.5
2020-04-30
Resolved Issues
- Combo Chart doesn't show all values when data representation is set to Line. (LIB-5267)
- Y-axis labels font size updated when number of bars change. (LIB-4469)
- Column "2" shifts to column "1" location when column "1" has null value. (LIB-5263)
- Axis not displayed or too small in Horizontal mode. (LIB-4395)
- Vizlib Combo Chart does not follow the separators set by the load editor when axis tick format is 10.00k. (LIB-4436)
1.4.4
2020-02-12
Resolved Issues
- Too much white space under the x-axis in horizontal mode. (LIB-4391)
- Arrows in legend of combo chart not working on iPad. (LIB-4404)
- Axis title for the secondary axis is missing. (LIB-4410)
- Setting Color Scheme to Single Color hides the Legend option. (LIB-4325)
- Issue when Selecting Alternative Dimensions. (LIB-4393, LIB-3339)
- Switching the X-axis on a published combo triggers an error. (LIB-4440)
- Hiding Legend also Hides Y axis set to Secondary Position. (LIB-4481)
- Row-level color not calculating for line style in Combo Chart. (LIB-4376)
1.4.3
2019-10-17
Resolved Issues
- Drilldown Icon Incorrect in june'19 & sept'19. (VZB-2277)
- Legend Sort Order reversed compared to data section. (VSP-783)
- Alt drill-down dimension not working with Vizlib Combo Chart in Master item. (VSP-651)
- Dates and points don't work anymore after the upgrade from 1.3 to 1.3.3. (VSP-956)
1.4.2
2019-10-02
Resolved Issues
- Adding localization to number formatting. (VZB-2150)
- Corrected minor issues on a date or duration axis. (VZB-2197)
- No inheritance of calculated label from master items. (VSP-772)
- Improved accuracy minicharts. (VZB-2086)
- Bars not always stacking. (VZB-2226)
- Corrected axis number formatting. (VSP-581)
- Axis Label overlaps with y ticks. (VZB-2225)
Performance Improvement
- Browser sometimes slows down when Vizlib Combo Chart is initialised. (VZB-2090)
Resolved Issues
- Corrected issues with overlapping bars. (VZB-2227)
1.4.1
2019-09-20
Resolved Issues
- Arrow icons in combo chart legend are missing in Qlik Sense September 2019. (VZB-2017)
1.4.0
2019-09-12
Resolved Issue
- Measure Axis number formatting has an extra decimal showing. (VSP-818, VSP-810)
- If secondary axis is displayed, bars with negatives are not displayed. (VSP-763)
New Features
- Vizlib Combo Chart y-axis labels override character limit. (VSP-567)
- Vizlib Combo Chart implement time/duration formatting for y-axis values. (VZB-1578)
Resolved Issues
- Double width bar of a measure at the first value of a dimension in a combo chart. (VSP-631)
- Incorrect coloring if one item is selected when using the gradient. (VZB-1291, VZB-1932)
1.3.3
2019-07-26
Resolved Issues
- Memory Optimisation. (VZB-1853)
- Custom Colours are not used on the lines of the Vizlib Combo Chart. (VSP-665)
1.3.2
2019-06-18
Resolved Issues
- Qlik Sense June 2019 support. (VZB-1540)
- Removing calculation condition then refresh creates issues on Chrome. (VSP-606)
1.3.1
2019-05-24
Resolved Issue
- Number Formatting issues. (VSP-505)
- Qlik Sense April 2019 Support. (VZB-1235)
- Combo line rendering bugs when measures shown on condition. (VSP-415)
New Features
- Add show values feature for icons and symbols. (VSP-531)
Resolved Issues
- Tooltip Data values in Vizlib Combo Chart have additional rounding applied. (VSP-526)
1.3
2019-03-28
Resolved Issues
- After switching between axis positions chart is displayed outside axis area. (VZB-604)
- Vizlib Combo Chart radius issue. (VZB-893)
- Corrected errors caused by false calc condition of bars. (VZB-584)
New Features
- implemented bar background image pattern. (VZB-733)
- Inherit native number abbreviation formatting from the script. (VSP-251)
- Possibility to display data values on line chart. (VSP-308)
1.2
2019-02-25
New Features
- Enhanced Data Values auto font colour and font auto-sizing options. (VZB-694)
- Add button group [small|medium|large] for Data Values auto sizing. (VZB-629)
Resolved Issues
- Conversion from Vizlib Bar Chart -> Vizlib Combo Chart not working. (VZB-729)
- Alternate state panel component inconsistent. (VZB-682)
1.1
2019-02-07
Resolved Issues
- When selecting bars, some data points are not highlighted. (VZB-647)
- Some settings were not carried over when the extension was created with visualisation API. (VSP-209)
- Nulls are connected by lines on horizontal orientation. (VZB-667)
- Issues with Secondary Axis on the Combo Chart. (VSP-194)
- Bar opacity not working as normal. (VZB-624)
New Features
- Added option for each measure to hide measure labels from y-axis/alternatives. (VSP-195)
Resolved Issues
- Line presentation is to the right hand side. (VZB-615)
1.0.2
2019-02-01
Resolved Issues
- Version 1.0.1 ComboChart changes Line Graph position. (VSP-188)
1.0.1
2019-01-31
Resolved Issue
- Line chart exceeds drawing area. (VZB-585)
- Apply changes that prevent crashing if shape is undefined. (VZB-608)
- Incorrect value in tooltip if benchmark is applied. (VZB-582)
1.0.0
2019-07-25
Initial release
- Initial release.