Vizlib KPI Designer Changelog
The following features were introduced to Vizlib KPI Designer:
2.8.1
2025-02-24
Updates
- Angular update. (VIZ-21604)
2.7.1
2024-10-15
Updates
- The extension loaders have been updated. The updated loaders don't interfere with your company branding. (Loaders)
2.6.0
2024-04-23
New Features
- Compatibility with Viztips - Vizlib KPI Designer v2.6.0 can be used inside the updated Viztips. For more information, see Viztips Overview.
2.5.1
2024-02-22
New Features
- Updated Vizlib Actions URL. To improve the usability and experience when developing our charts, the Vizlib actions URL is updated to Vizlib Actions Overview. (LIB-13671)
2.5.0
2024-02-15
Resolved Issues
- Vizlib KPI Designer - Custom Number Abbreviation Issue. The Vizlib KPI designer now uses the same method for number abbreviation as the Qlik KPI object. (LIB-13304)
2.4.0
2023-09-19
New Features
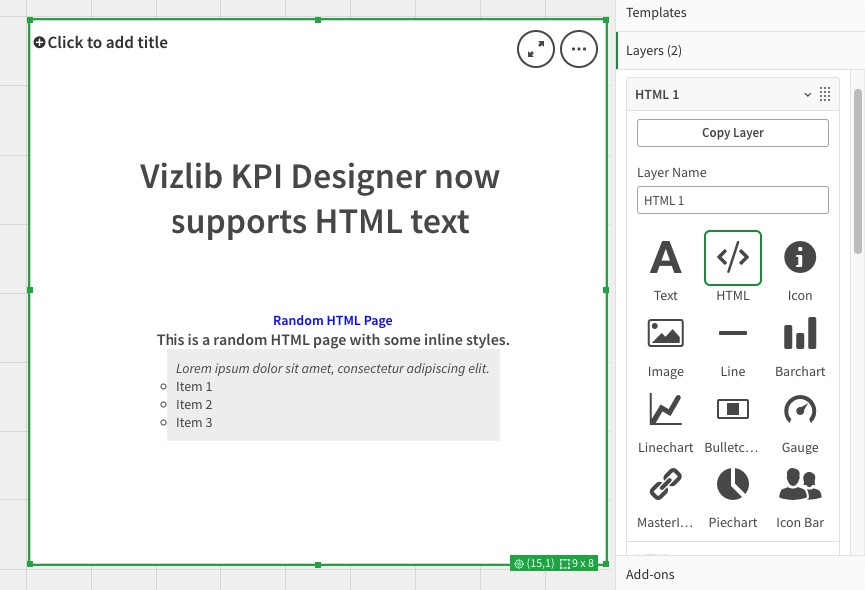
- Add HTML in designer KPI text object.
- Introducing the latest and greatest enhancement to Vizlib KPI Designer – the ability to seamlessly integrate HTML Layers! Say goodbye to the need for additional Master Items to achieve a HTML design within your KPI Designer.
- But that's not all! This fantastic feature isn't just about convenience; it's also a game-changer for optimizing performance. You can now turbocharge your KPI Designer by streamlining your layering strategy.
- As an example: Instead of cluttering your workspace with multiple layers just to display text in a grid, you can achieve the same result with a single, powerful layer whilst allowing you to add Vizlib Actions on top!
- This enhancement not only simplifies your design process but also supercharges the speed and efficiency of your Vizlib KPI Designer. It's a win-win that takes your data visualization to the next level! (LIB-11257)
-
2.3.7
2023-08-11
Security Updates
- Follow the link below for the latest important security updates for Vizlib Extensions. More information...
2.3.6
2023-07-05
Resolved Issues
- Vizlib KPI Designer - Not always generated in the PPT exported report. We have improved the Vizlib KPI Designer tool to make it work better when exporting to PowerPoint using nPrinting. Some users had problems where the tool wouldn't generate the exports properly. With this new update, we have fixed the problem so the tool will work properly and fully in your nPrinting exports. (LIB-11913)
2.3.5
2023-05-24
Resolved Issues
- Additional options fail to show up on Icon Layers. There was an issue when users were in Edit Mode and added an Icon Layer to the KPI Designer. Then in Analysis mode this resulted in the Context Menu not appearing. (LIB-12607)
2.3.4
2023-04-26
Resolved Issues
- Linechart is cut off. The top of the KPI's simple Line Chart is cut off. (LIB-12441)
- Viztips doesn't render at random. A problem occurred for users where they would use Viztips for the Combo Chart and the end result would be that their Viztip wouldn't render. (LIB-12430)
- KPI basic Line Chart is cut off at top of object. When you use the KPI Basic Line Chart visualisation the line is partially cut at the top. (LIB-12441)
- Viztips, KPI Designer related, don't always render. When hovering over the data points in the combo chart, at random the Viztips displays a loading image but doesn't render. (LIB-12430)
2.3.3
2023-02-17
Resolved Issues
- Clone, Remove,Copy, Paste layer options aren't responding to selection. In edit mode on the KPI designer, you were unable to Clone, Remove, Copy and Paste existing layers. (LIB-12052)
- Not always generated in the PPT exported report. At random, exporting the KPI Designer for PowerPoint, certain elements would not render completely. (LIB-11913)
-
Not printing when used in Mail and Deploy Report. For customers who are using Mail and Deploy, they were sometimes experiencing missing KPI Designers on their exports. (LIB-12129)
- Selection in Vizlib Filter added as MI doesn't work when using the filter as a Master item inside a KPI Designer. You're able to use the Vizlib Filter as a master item once again. There was a bug which meant in the previous version of the KPI Designer you were unable to interact with the Vizlib Filter. (LIB-12057)
2.3.2
2022-12-19
Resolved Issues
- In a mashup the tooltip doesn't render or displays in an incorrect position. The tooltip position, when you have the KPI Designer, was frequently showing up in the wrong position, or was not rendering at all. (LIB-11624)
- KPI Designer Gauge has an inconsistent display of values. One of the KPI Designer's inbuilt charts, the 'Gauge', showed inconsistent value. (LIB-11667)
2.3.1
2022-10-11
New Features
- Vizlib KPI Designer and Master Item objects. (LIB-11354)
Resolved Issues
- Container Grid: KPI Formatting isn't retained when switching Tabs. (LIB-11391)
2.3.0
2022-08-11
New Features
- Vizlib KPI Designer and Master Item objects. (LIB-11354)
Resolved Issues
- KPI Designer - Full Screen Show/Hide Setting Ineffective on QS May 22 and Cloud. (LIB-11392)
- VizlibKPI images does not work after transfer app to cloud. (LIB-11195)
2.2.9
2022-07-07
Resolved Issues
- Vizlib KPI Designer + Qlik NPrinting. (LIB-11093)
- VizLib KPI Designer v2.2.8 fails on NPrinting Task with report type - Qlik Entity. (LIB-11122)
2.2.8
2022-04-04
Resolved Issues
- KPI Designer - Incorrect empty KPIs when exporting Story to PPT. (LIB-10948)
2.2.7
2022-02-15
New Features
- Number Formatting Change in Behavior. (LIB-10847)
2.2.6
2022-02-01
Resolved Issues
- Images in Qlik Cloud. (LIB-9338)
2.2.5
2021-12-07
Resolved Issues
- Number Formatting in Auto Mode. (LIB-10656)
- Number Formatting Display. (LIB-10560)
2.2.4
2021-11-07
Resolved Issues
- Icon Bar Layer Display. (LIB-10439)
- Display on Safari Browser. (LIB-10442)
- Display on iPhone. (LIB-10392)
- Export to PDF. (LIB-10285)
2.2.2
2021-10-11
Resolved Issues
- Number Custom Formatting. (LIB-10089)
- KPI number formatting. (LIB-10290)
- Field Selections Action. (LIB-10265)
2.2.0
2021-08-19
New Features
- Support for Ridgeline Plot. (LIB-9188)
Resolved Issues
- Icon Expression Editor. (LIB-9730)
- Vizlib Writeback Bulk Edit is Blocked. (LIB-9393)
2.1.0
2021-07-16
Resolved Issues
- Variables Usages in Custom Format LIB-8476. (LIB-9396)
- Console Errors. (LIB-9580)
- Negative Number Formatting. (LIB-9540)
2.0.1
2021-06-17
Resolved Issues
- Number Formatting in Text Layer. (LIB-9361)
- Layers Resizing in Analysis Mode. (LIB-9268)
2.0.0
2021-05-26
Resolved Issues
- KPI Display in Mashup. (LIB-9092)
- Action to Set Variable Value. (LIB-9052)
1.19.0
2021-04-19
Resolved Issues
- Layer Resizing. (LIB-8615)
- Set Variable Action in Mashup. (LIB-8215)
1.18.3
2021-01-20
Resolved Issues
- Global Action Set Variable. (LIB-8331)
- Global Action Override Context Menu. (LIB-8354)
- Export Multiple KPI Objects. (LIB-6572)
- Global Action in Mashup. (LIB-8215)
1.18.2
2021-01-04
Resolved Issues
- Browser Crash. (LIB-8227)
- Image Layer Display. (LIB-8108)
1.18.1
2020-12-08
Resolved Issues
- Global Action= Field Selection. (LIB-7905)
- Image Layer PPT Export. (LIB-7870)
1.18.0
2020-11-27
New Features
- Waterfall Display in KPI Designer. (LIB-7533)
Resolved Issues
- IE Support. (LIB-8005)
- Qlik Sense Stories Design. (LIB-7578)
- Performance Improvement. (LIB-7858)
- App Number Formats Support. (LIB-7924)
- Text Layer Indicator Display. (LIB-7367)
- Text Layer Indicator Display. (LIB-7915)
- Text Layer Number Custom Format. (LIB-7519)
1.17.1
2020-11-13
Resolved Issues
- Action Not Working. (LIB-7520)
- Number Display. (LIB-7559)
- App Number Format Setting. (LIB-7324)
1.17.0
2020-10-29
New Features
- "Sleep" Action. (LIB-7076)
Resolved Issues
- Negative Values Display. (LIB-7172)
- Line Layer Display. (LIB-7164)
1.16.1
2020-10-01
Resolved Issues
- Text Layer Indicator display. (LIB-7121)
- Text Layer Indicator display. (LIB-7115)
- Text Layer custom number formatting. (LIB-6964)
- Icon display. (LIB-7052)
1.16.0
2020-09-10
New Features
- Enhanced custom padding. (LIB-6324)
- Enhanced image sizing options. (LIB-6578)
Resolved Issues
- Exporting Story to pdf doesn't work properly if we have master item on KPI. (LIB-6572)
1.15.1
2020-09-03
Resolved Issues
- Indicator doesn't provide correct output with Expressions greater than 999. (LIB-6506)
1.15.0
2020-07-31
New Features
- New KPI Designer templates and a new font available! (LIB-6531)
1.14.1
2020-07-24
Resolved Issues
- Line Chart layer representation not displaying zero values. (LIB-6378)
- Export to PDF on KPI shows error OR invalid visualisation. (LIB-5761)
- Auto number formatting rounding numbers. (LIB-4771)
- Number formats caused showing incorrect idicator. (LIB-6211)
1.14.0
2020-07-13
New Features
- Use Variable in "Define your own font family". (LIB-5250)
Resolved Issues
- Mekko Master Item doesn't show up on KPI Designer master item list. (LIB-5978)
1.13.1
2020-05-26
Resolved Issues
- Click-to-launch property panel functionality stopped working on layer click. (LIB-5846)
1.13.0
2020-05-07
New Features
- Property Panel Search. (LIB-5679)
Resolved Issues
- Bar Chart layer representation is not displaying zero values. (LIB-5628)
1.12.0
2020-04-30
New Features
- Adjust KPI Designer to work with Viztips. (LIB-5715)
1.11.0
2020-04-21
New Features
- Performance analysis and improvement. (LIB-5098)
- Copy paste layers. (LIB-4860)
Resolved Issues
- Vizlib KPI Designer makes multiple request unnecessarily. (LIB-5412)
1.10
2020-03-19
New Features
- Add Icon Bar layer. (LIB-5094)
1.9.4
2020-02-21
Resolved Issues
- Fixes for changes in methods in Qlik Sense February 2020. (LIB-4525)
1.9.3
2020-02-07
Resolved Issues
- Add info message for on-premise extensions. (LIB-4726)
1.9.2
2020-02-04
Resolved Issues
- Add info message for on-premise extensions. (VZB-3466)
- Layers could not be moved in master items. (VZB-1293)
- Vizlib Bar Chart in KPI Designer Layer shows values when chart disables. (VSP-1192)
1.9.1
2020-01-29
Resolved Issues
- File in Vizlib KPI forces use of default proxy. (VSP-1293)
1.9.0
2020-01-15
New Features
- Added Vizlib Templates! (VZB-3295)
1.8.1
2020-01-03
Resolved Issues
- Using a variable for image URLs doesn't resize image in Vizlib KPI Designer. (VSP-1127)
- Tooltips display in wrong places after close full screen in analysis mode. (VZB-2424)
- When KPI is saved as master item, layers cant be moved because of error. (VZB-1293)
1.8.0
2019-11-25
New Features
- Add multi-line auto-fit text option for text layers in the Vizlib KPI. (VSP-490)
Resolved Issues
- Invalid Parameters error with KPI extension. (VSP-1101)
- When you extend the sheet the tooltip is moving down with it. (VZB-2428)
- File in Vizlib KPI forces use of default proxy. (VZB-2308)
- Broken images after exporting App then importing to different Qlik Sense environment. (VSP-838)
- Invalid or blank KPI in Story mode. (VSP-1106)
1.7.5
2019-11-01
Resolved Issues
- VizLib KPI Designer - Unable to Select Auto Number Format. (VZB-2360)
- Number formatting incorrectly applied in export to pdf. (VZB-2358)
- KPI master item is editable inside a container. (VZB-2309)
1.7.4
2019-10-23
Resolved Issues
- KPI Designer custom Font not working. (VSP-947)
- Auto-sizing of text incorrectly applied. (VSP-957)
- Background color covers image layers. (VZB-1968)
- BulletChart layer appears too small after upgrade. (VSP-970)
1.7.3
2019-10-11
Resolved Issues
- Number separators from the load script are ignored. (VSP-860)
- Image thumbnail from Media Library does not display any image. (VSP-569)
- Broken images after exporting App and then importing to different QS environment. (VSP-838)
1.7.2
2019-10-04
Resolved Issues
- Zooming out and in- some data disappear but then reappear when refreshing the page. (VSP-824)
- Clicking on the Text icon overwrites the title of the layer. (VSP-791)
- After exiting Full Screen, the bullet chart is not displayed correctly. (VSP-792 , VSP-788)
- Remove "Export Data" option in context menu. (VZB-1075)
1.7.1
2019-09-20
Resolved Issues
- Icons in object are missing (arrows, context menu). (VZB-2069, VZB-2181)
- Vizlib Action URL opens twice on previously created objects. (VSP-809)
- NPrinting does not print all Vizlib KPI objects (one missing at random). (VSP-767)
1.6.0
2019-08-14
New Features
- Implemented Master Items layer. (VZB-1601)
- Implemented Pie Chart layer. (VZB-1597)
Resolved Issues
- Context menu (right-click) missing from Internet Explorer. (VZB-1914)
- Gauge layer color discrepancy with Internet Explorer. (VSP-746)
- KPI Design mode is not aligning properly. (VSP-669)
1.5.7
2019-07-10
Resolved Issues
- Exporting to PowerPoint/PDF a full sheet with KPI objects returns some blank object. (VSP-662)
- Improved full screen load time. (VZB-1740)
1.5.6
2019-07-04
Resolved Issues
- Improved performance when many KPI Designers exists on the same sheet. (VZB-1657)
1.5.5
2019-06-21
Resolved Issues
- Qlik Sense June 2019 support. (VZB-1528)
- Repeated API calls triggered by having multiple Vizlib KPI Designer objects. (VZB-1652)
1.5.4
2019-06-14
Resolved Issues
- Auto Number formatting adds rounding when decimals are used. (VZB-1350)
1.5.3
2019-05-21
Resolved Issues
- Auto Number formatting rounding some numbers. (VSP-528)
- White gap around object when using sense focus theme. (VSP-497)
1.5.2
2019-05-10
Resolved Issues
- VZB-1293, VZB-1183 , VZB-1184 , VZB-1154 , VZB-1185 Qlik Sense April 2019 Support.
1.5.1
2019-04-18
Resolved Issues
- KPI Tooltip - left position not working. (VSP-434)
- Null in KPI Designer shows as NaN instead of "-". (VSP-439)
- KPI border radius does not apply to background object. (VSP-459)
1.5
2019-03-15
New Features
- Add expression option for border width Bug Fixes. (VSP-383)
- Thousands separator in number format produces bad format. (VSP-374)
- Vizlib KPI bug in version 1.4.2 - console errors. (VSP-360)
- Tooltip and action don't work properly together. (VSP-241)
1.4.3
2019-03-04
Resolved Issues
- Fixed restriction to place and size objects in KPI canvas. (VSP-347)
- Corrected printing PDF/img/ppt and nPrinting. (VSP-348)
- show/hide condition - icon will not appear until you move to edit mode again. (VSP-346)
1.4.2
2019-02-27
Resolved Issues
- KPI Image library doesnt take virtual proxy into account. (VSP-293)
- nPrinting/pdf/img issue in KPI. (VSP-302)
1.4.1
2019-02-26
Resolved Issues
- NaN in text layer when format number that contains text. (VSP-294)
1.4
2019-02-25
New Features
- Number formatting, use QLIK SI notation (billions, millions etc). (VSP-254)
- "Auto" Number format setting compatible with custom negative values. (VSP-253)
- Performance optimisations in edit mode when there are lots of layers (30+). (VZB-200)
- Allow an expression to be used in the calculation condition display message Bug Fixes. (VSP-215)
- Reduce number of decimal places shown in default setting. (VZB-618)
- Vizlib Action - Data not saved after user-triggered reload. (VSP-264)
- Line Layer - Line Style is not applied. (VSP-186)
- Empty space above KPI Area when on Sense Focus. (VSP-261)
- Tooltip not hiding after moving to a different page via button. (VZB-474)
- Large border thickness places gauge layer values outside the object. (VZB-619)
1.3.2
2019-01-25
Resolved Issues
- Multiple Actions no applied in sequence. (VSP-162)
- Hide duplicate alternate states. (VZB-489)
- Corrected edge cases that where making the extension not to render. (#162452066)
- calc cond. expression message not applied. (#161778633)
1.3.1
2018-12-21
Resolved Issues
- KPI breaks native text object. (#162687413)
1.3
2018-11-20
New Features
- Implement pdf/ppt printing. (#161206715)
- Added new KPI Designer layer type. (#160885819)
- Add slider for container style opacity. (#161474018)
1.2.2
2018-10-23
Resolved Issues
- HTML tags style were not loaded in the tooltip. (#161392934)
- tooltip was not evaluating expressions. (#161391174)
- title tooltip on icon. (#161392999)
- removed min width on tooltips. (#161394837)
- tooltip default text to 13px. (#161394940)
1.2.1
2018-10-14
New Features
- Add Qlik's Custom formatting on text layer. (#161200652)
1.2
2018-10-09
New Features
- Adding Tool tip in KPI Designer text layer. (#160694514)
- conflict with Vizlib KPI+ Vizlib Pivot in offline mode. (#160864300)
- Fix edit mode in iPad. (#160603382)
- Duplicating layers. (#160793213)
1.1
2018-09-20
New Features
-
Added sorting (by dimension & measure) in the Line and Bar chart layers.
Resolved Issues
- Changing axis label font size wasn't working on the bullet chart layer. Borders settings were not getting applied on the Bar chart layer.
- Missing some axis values on the bullet chart layer. Fixed some rendering issues on IE.
- Fixed unused top/bottom margin in layers.
- Fixed css conflicts between Vizlib KPI and Vizlib Pivot Table. Fixed some css cuts on the text layer in Firefox.
-
Right click was not showing the layers menu in some screen sizes & browsers.
Additional Changes
Performance Improvements
- Make drag-and-drop of layers more performant. (LIB-10302)
- KPI no longer takes time to render. (VSP-727)