Vizlib Line Chart Changelog
The following software changes were introduced in the latest release:
5.9.1
2025-03-20
New Features
- Vizlib Line Chart supports Cyclic Dimensions. For more information, see Cyclic Dimensions. (VIZ-21836)
5.8.0
2025-02-12
Updates
- Angular update. (VIZ-21605)
5.7.1
2024-12-10
Improvements
- insightsoftware has improved the Line Chart paint handler. As a result, Nprinting and printing the report to PDF is more reliable. (VIZ-21678)
5.7.0
2024-10-15
Improvements
- General performance and usability improvements. (VIZ-9433)
Updates
- The extension loaders have been updated. The updated loaders don't interfere with your company branding. (Loaders)
5.6.3
2024-08-29
Resolved Issues
- The data exported from Vizlib Line Chart used in Qlik SaaS was invisible due to solid coloring of the cells. (VIZ-21380)
5.6.2
2024-07-01
Resolved Issues
- Chinese characters in Y axis displayed in an incorrect direction. (VIZ-13762)
5.6.1
2024-03-28
Resolved Issues
- If the domain was not found, no data was displayed in the Line Chart or the chart showed loading state. (LIB-13750)
- When users attempted to convert a Vizlib chart in the sheet to a Vizlib Line Chart, by dragging and dropping it into an existing chart, data was not visible and the chart showed loading state. (LIB-13682)
5.6.0
2024-01-25
New Features
- Estimated Auto ticks display works difference when having more than 1 dimension in x-axis. (LIB-13090)
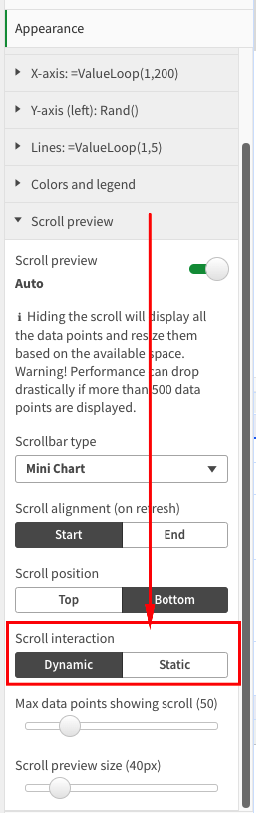
- You can now define the scroll interaction as Dynamic or Static for the Mini Chart Scrollbar. This gives your users the benefit of understanding the full scope of the project, but as the Developer, you can control if the user can scroll zoom in/out.
5.5.3
2023-12-28
Resolved Issues
- Reference lines need two reference objects to appear. Multiple reference lines were needed for the first one to show up. (LIB-13201)
5.5.2
2023-12-11
Resolved Issues
- Line Chart with different icons is not always exported correctly to PDF, The export to PDF would not always replicate your chart if you were using different icons for the node points. (LIB-12034)
5.5.1
2023-12-01
Resolved Issues
- Data is not displayed the same way as in Qlik native Line Chart. With this change we adjust the y-axis alignment to be closer to the one used in the Qlik native chart which should be more logical for most use-cases. (LIB-13332)
5.5.0
2023-10-26
New Features
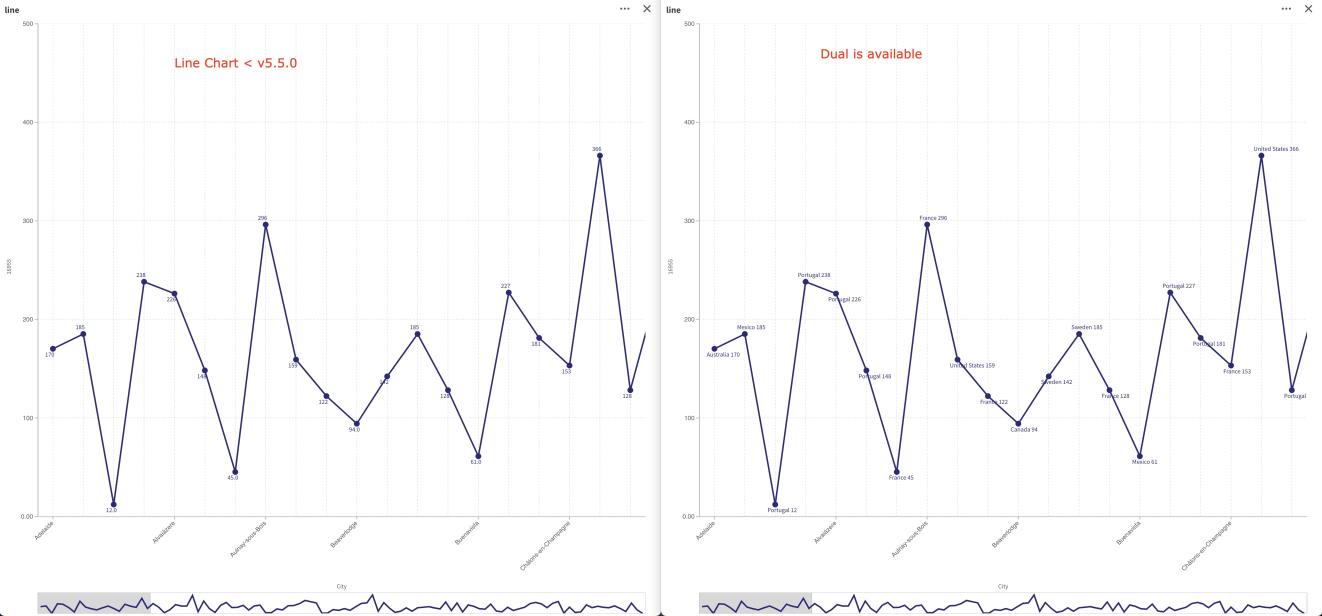
- Dual Function is available. (LIB-11693)
Resolved Issues
- Data point labels are obscured by chart. (LIB-12988)
- We have improved the positioning of our Vizlib Line Chart line values. The placements before hand could have looked irregular depending on the placement of the line and label value.
- As a result, we have invested heavily into effective positioning of Line Values, ensuring users get a consistent view on where the data points lie and, alongside custom editing of the values, you can ensure a cohesive look and feel for all Vizlib Line Chart values.
5.4.1
2023-09-25
Performance Improvements
- Vizlib Line Chart with Tooltips. The Tooltips have seen some significant improvements which improved overall performance. (LIB-12138)
Resolved Issues
- Support for NumericalAbbreviation. Defining your own 'SET NumericalAbbreviation' will now be achievable within the Vizlib Line Chart. No settings are required to apply this. (LIB-12987)
- Data Gaps option does not work. The Data Gaps option was not functioning correctly within the Vizlib Line Chart. However, this fix has been implemented to appropriately show Data Gaps. (LIB-12086)
- Preview Spacing is inconsistent when placed in Vizlib Container. When you place the Line Chart in a VIzlib Container, the Scroll preview had inconsistent spacing. (LIB-13061)
5.4.0
2023-05-26
Resolved Issues
- Stack feature is not working. Users who are upgrading from Line Chart <= v5.3.0 and were using the 'Stacked' feature of the Line Chart must use this version or greater as an error resulted in the stacked feature not working correctly. (LIB-12652)
New Features
- Auto Place Data Driven Annotations. (LIB-12122)
- Auto placement of the Line Chart's Annotations has seen a major overhaul and with the benefit of better placement of the Data Driven annotations. These Annotations can understand surrounding lines and better place themselves.
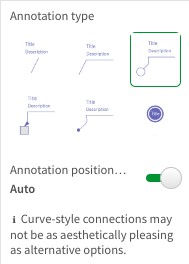
Note: Curved line styles and other complex line, or, many lines may result in a harder placement of these Annotations.
New Features
- Scrollbar update (LIB-11656)
- As seen with the Bar Chart release in v4.2.0, you have the options to change the scrollbar for the Vizlib Bar Chart found in Appearance > Presentation > Scrollbar type. We now have the following options:
- Mini chart - Presents a mini-cart scrollbar which can be interacted with by scrolling and resizing.
- Advanced - You can interact by scrolling and resizing.
- Basic - You can only interact by scrolling (This is a fixed with determined by the number of bars you want to show by the 'Set Threshold Limit' property).

Example of what the Bar Chart looks like
5.3.1
2023-03-17
Resolved Issues
- Chart stuck in the loading loop after upgrading. Console errors and incomplete loading of the Line Chart was noticed. (LIB-12305)
- Vizlib Line Chart - Limiting dimension values won't show "Other" label. When you limit the dimension values, for example to only display 5, the "Other" label is not present. (LIB-12262)
5.3.0
2023-02-28
New Features
- You can select Dimension lines on the Vizlib Line Chart. (LIB-8769)
- Like in the Vizlib Bar Chart, the Vizlib Line Chart now has the option for 'character limit' so you can manually adjust the number of character to display on your axis. (LIB-8122)
- For line charts that have a horizontal dimension name, the selectable area on the X-axis to quickly select dimensions was very small. This has been increased to improve usability and user experience. (LIB-11452)
Resolved Issues
- There were cases where some tooltips would not always appear. (LIB-12030)
- You couldn't change the forecasting line colour for lines after the forecast point. (LIB-10381)
5.2.4
2023-01-11
Resolved Issues
- When scroll preview disabled chart is not resized to view all data. When scroll preview is not enabled and the Line Chart legend is on the right or left, the data becomes truncated. (LIB-11737)
5.2.3
2022-10-27
Resolved Issues
- Tooltip Inconsistently Displaying on Hover. (LIB-11609)
- Exported file throws an error when proxy is used in Qlik Sense. (LIB-11395)
- Data Points being cut off. (LIB-11637)
- Dates are Being cut off in X-AXIS. (LIB-11445)
- X axis labels font is somewhat blurry. (LIB-11492)
5.2.2
2022-07-08
Resolved Issues
- Copy-Paste measure from a different chart doesn't work. (LIB-11176)
- Axis ticks are being cut off. (LIB-11232)
5.2.1
2022-06-15
Resolved Issues
- License calculation issue. (LIB-11287)
5.2.0
2022-06-08
New Features
- Support Export to XLSX (with Forecasting) on the Cloud. (LIB-11163)
Resolved Issues
- Line Chart recalculating issue. (LIB-11181)
- Line Chart Produces Incorrect Auto Range. (LIB-11187)
- Line is missing when all data points have the same value. (LIB-11084)
5.1.0
2022-05-11
New Features
- Export to XLSX (incl. forecasting). (LIB-11170)
Resolved Issues
- Vizlib Line Chart Dashboard is causing slow downs. (LIB-10964)
5.0.3
2022-03-28
Resolved Issues
- Label on Japanese y-axis of Line Chart not working as expected. (LIB-10856)
5.0.2
2022-02-15
Resolved Issues
- Consistent Colors Doesn't Work. (LIB-10883)
- Browser Unresponsive in Edit Mode. (LIB-10854)
5.0.1
2022-02-03
Resolved Issues
- Dimension Sorting (LIB-10810)
- Non-Date numeric dimensions sorting is broken when using two dimensions in the chart.
- Alternative Measures Labels. (LIB-10744)
5.0.0
2022-01-24
New Features
- New Forecasting Algorithm and Capabilities. (LIB-10777)
4.1.6
2021-11-10
Resolved Issues
- Display in IPad and Safari. (LIB-10296)
- Tooltip Display. (LIB-10436)
- Lines Colors. (LIB-10313)
- Tooltip display. (LIB-10231)
4.1.5
2021-10-27
Resolved Issues
- Data Points Value Display. (LIB-10365)
- Alternative Measures Labels Display. (LIB-10356)
- Chart Rendering. (LIB-10289)
- Coloring by Segment. (LIB-10235)
4.1.4
2021-10-15
Performance Improvements
- Tooltip Refactor. (LIB-10364)
4.1.3
2021-10-04
Resolved Issues
- Having a visibility condition for 1 of 2 measures has an incorrect line display value for the line chart. (LIB-10141)
4.1.2
2021-09-22
Resolved Issues
- Calculation Condition Breaks the Chart [LIB-10026]. (LIB-10142)
- Second Measure Display. (LIB-10141)
- Data Values Display. (LIB-9897)
- Line Chart Display in Nprinting Reports. (LIB-9899)
- Y-Axis Custom Label Display. (LIB-10079)
- Legend Display. (LIB-10085)
2021-09-06
Resolved Issues
- Qlik Themes. Applying a Qlik theme in the app, doesn't affect Vizlib Line Chart. (LIB-10066)
4.1.0
2021-08-31
New Features
- Static Legend Width (LIB-9360)
- Alternative Measures and Dimensions. (LIB-859)
4.0.5
2021-08-04
Resolved Issues
- Line Chart in Nprinting. (LIB-9655)
- Multi Line Tooltip Display. (LIB-9679)
- Manual Annotation. (LIB-9711)
- Tooltip Diaply. (LIB-9430)
4.0.4
2021-07-01
Resolved Issues
- Invalid Visualization. (LIB-9364)
- Line Chart Loader. (LIB-9411)
4.0.3
2021-06-04
Resolved Issues
- Reference Objects Calculation Condition. (LIB-9203)
- Scroll Preview Display. (LIB-9256)
- Chart Display On A-axis. (LIB-9257)
- Time Aware Ticks Display. (LIB-9275)
4.0.2
2021-05-25
Resolved Issues
- No Data Message. (LIB-9089)
4.0.1
2021-04-13
Resolved Issues
- Data Gaps Display. (LIB-8870)
- Advanced Analytics Number Formatting. (LIB-8307)
- Legend Scroll Buttons. (LIB-8702)
- Vertical Segment Colors. (LIB-8628)
- Loader Background Display. (LIB-8935)
- Rendering Image is Stuck. Line chart v4 stuck on rendering image when added to a sheet with button. (LIB-8937)
4.0.0
2021-03-31
Performance Improvements
- This version include re-factoring of the core build of this chart. These changes will improve chart performance and stability. (-)
3.11.0
2021-02-26
Performance Improvements
- Context Menu Enhancements. (LIB-6207)
3.10.2
2021-02-10
Resolved Issues
- Data Driven Annotations Show\Hide. (LIB-8486)
- Tooltip Display. (LIB-8389)
- Custom Color Display. (LIB-8173)
- Advanced Analytics Number Format. (LIB-8307)
3.10.1
2021-01-04
Resolved Issues
- Legend Sorting. (LIB-8064)
- Labels Display in Forecast. (LIB-8098)
- Label Display. (LIB-7828)
3.10.0
2020-12-22
New Features
- Data Driven Annotation. (LIB-7293)
- Data Driven Annotation. (LIB-7293)
Resolved Issues
- Console Errors. (LIB-8220)
- Null Value Is Displayed. (LIB-8118)
- Legend Display. (LIB-7953)
- Scenarios and Linear Regressions Display. (LIB-7996)
- Tooltip Display Error. (LIB-7414)
- Tooltip Display Stuck. (LIB-7854)
- Markers Display. (LIB-7974)
- Area Display combined with Gaps. (LIB-7958)
- Null Value Points Display. (LIB-7542)
- Y-Axis Scale Display. (LIB-7894)
- Data Display Error. (LIB-7565)
- Advance Analytics Message. Advance Analytics message is automatically displayed when dimension is replaced. (LIB-7478)
- Suppress Zero Values. (LIB-7573)
- Advanced Analytics Display. (LIB-7809)
3.9.5
2020-10-29
Resolved Issues
- Forecast Area Display. (LIB-7323)
- Story Export. (LIB-6629)
3.9.4
2020-09-30
Resolved Issues
- Export Story. (LIB-6980)
- Y-axis scale. (LIB-7051)
- Tooltip Display. (LIB-7066)
- Data download. (LIB-7082)
3.9.3
2020-09-08
Resolved Issues
- Tooltip does not display the measure label name on all lines. (LIB-6913)
- Using auto Axis Range does not show the lines on the chart. (LIB-6944)
3.9.1
Resolved Issues
- Tooltip missing on hover.. (LIB-6487)
- Y axis labels truncated on mashups. (LIB-6411)
- Rendering error after in some cases where set analysis is used. (LIB-6208)
3.9.2
2020-09-04
Resolved Issues
- If statements limited display of accumualted values. (LIB-6744)
- Axis disappeared when configuration changed. (LIB-6630)
- Secondary axis update issue when toggling advanced analytics. (LIB-6431)
3.9.0
2020-07-30
New Features
- New Advanced Analytics Forecasting type. (LIB-5620)
3.8.3
2020-07-24
Resolved Issues
- Line Chart Tooltip hidden by object border/legend. (LIB-6439, LIB-6209, LIB-6330, LIB-4226)
- Reference line missing. (LIB-6145)
- Top right data point is always cut-off in the Vizlib Line Chart. (LIB-3779)
- Y-Axis scaling incorrect for some multi-line charts (non-stacked). (LIB-5985)
- X-Axis values not showing. (LIB-5570)
3.8.2
2020-07-07
Resolved Issues
- Some characters missing in tooltip measure/dim label. (LIB-6131)
- Opacity set to 1 when another Vizlib Line Chart was on the sheet. (LIB-5926, LIB-5902)
- Vizlib Line Chart doesn't update in IE 11. (LIB-6130)
3.8.1
2020-05-27
Resolved Issues
- Some multi-dimension line charts change after refreshing. (LIB-5969)
- Vizlib Line Chart Not Showing Initially in IE 11. (LIB-5981)
- Vizlib Line Chart did not update when selection generates no data. (LIB-5811)
- Forecasting is overshooting the x-axis. (LIB-5537)
3.8.0
2020-05-11
New Features
- Add highlight line on selection of line. (LIB-3639)
Resolved Issues
- "Show as Gap" option not working. (LIB-5706)
- Tooltip displays some characters as underscores. (LIB-5664, LIB-5657)
- Use of master dimensions hide chart. (LIB-5616)
3.7.0
2020-04-24
New Features
- Property Panel Search. (LIB-5349)
Resolved Issues
- Advanced Analytics confidence area not immediately updated. (LIB-5400)
- Line Opacity property does not use correct Qlik expression value. (LIB-5469)
- Segments styling not applied when axis is placed on the right hand side. (LIB-5464)
3.6.0
2020-04-01
New Features
- Master Item Colors. (LIB-5184)
3.5.0
2020-03-13
New Features
- Added support for showing gaps between lines. (LIB-3579)
- Add legend scroll and improve the legend to match the Vizlib Combo Chart. (LIB-3513)
Resolved Issues
- Line is going out of bounds in "Natural" Mode. (LIB-3694)
- Date missing when using multi tooltip. (LIB-4523)
- Linechart tolltip not working in single mode. (LIB-5089)
- Qlik Sense February 2020 Support. (LIB-3427)
- Vizlib Line Chart replicates data point when browser is resized. (LIB-3721)
- Legend does not take all the available space on the right hand side. (LIB-5090)
- Minichart cannot move in IE. (LIB-4419)
- Legend shown when unnecessary. (LIB-5273)
3.4.0
2020-01-03
New Features
- Improve x-axis ticks setting. (VSP-1017)
Resolved Issues
- Code conflict with other extensions prevented the Vizlib Line Chart from loading. (VSP-1201)
- Qlik Nov '19 Support for Custom fonts. (VSP-1079)
3.3.0
2019-12-18
New Features
- Implement New smart data label display (Prevent label overlapping). (VSP-752)
3.2.2
2019-12-09
Resolved Issues
- No Multi Tooltip displayed when the Vizlib Line Chart is in a container. (VSP-1040)
- The line chart displays only one label in the axis description. (VZB-2305)
- Cannot open the fx button of the Visibility Condition immediately. (VSP-1019)
3.2.1
2019-10-15
Resolved Issues
- Line Chart displays incorrect data when using small constant value in measure. (VSP-929)
- Inverted Comma thousand separator is displayed incorrectly on the axis. (VSP-805)
- Values cut off at the top and at the bottom of the chart. (VSP-729)
- Horizontal/Vertical background stopped working. (VZB-2300)
3.2.0
2019-09-27
New Features
- Support for Dark themes/background in Vizlib Line Chart. (VSP-845)
Resolved Issues
- VizLib LineChart - Tooltip out of the boundaries. (VSP-903)
- Left Y-Axis line remains even when not in use. (VSP-888)
- End of line cut off when 1 measure uses conditional expression. (VSP-851)
- x-axis missing from Vizlib Line Chart after selections. (VSP-895)
3.1.2
2019-09-16
Resolved Issues
- forecasting line number formatting issues. (VSP-743)
- Data points are not getting cleared after hovering. (VSP-820)
- Datapoints not connected when the measure has constant value. (VSP-614)
- no wizard after deleting a measures and dimensions. (VZB-2144)
- minor IE11 bug fixes. (VZB-2143, VZB-1905)
- Dimension labels overlaps chart area when position is not populated. (VZB-2016)
3.1.1
2019-09-03
Resolved Issues
- Data value labels are hidden beneath the x-axis. (VSP-576)
- Qlik Sense Desktop shows errors with Vizlib Line Chart. (VSP-827)
3.1.0
2019-08-28
New Features
- Implement auto option for number of ticks in y-axis. (VSP-578)
- Add HTML Custom Tool-tip to the Vizlib Line Chart. (VSP-786)
Resolved Issues
- Certain tool-tips were missing from lines. (VSP-813)
3.0.1
2019-08-01
New Features
- Memory Optimization. (VZB-1865)
3.0.0
2019-07-03
New Features
- Vizlib Advanced Analytics. (VSP-85)
2.6.1
2019-06-21
Resolved Issues
- Qlik Sense June 2019 support. (VZB-1480)
2.6.0
2019-06-14
New Features
- Vizlib Line Chart implement date/time/duration formatting for y-axis values. (VSP-85)
Resolved Issues
- Vizlib Line Chart horizontal stripes not in sync with ticks / grid. (VZB-1575)
- 'Auto' formatting creates rendering issue caused by certain metrics. (VSP-525)
2.5.1
2019-05-31
Resolved Issues
- Qlik Sense Desktop rendering issues. (VSP-523)
- Line chart rendering issues after small selection. (VSP-513)
2.5.0
2019-04-26
New Features
- Vizlib Line Chart - add zoom-in feature. (VZB-821)
- Vizlib Line Chart - mini chart. (VZB-858)
- Number Abbreviation support and Negative value formatting. (VSP-249)
Resolved Issues
- X-axis missing and values displayed outside of range. (VSP-472)
2.4.4
2019-04-10
Resolved Issues
- Two instances of the same objects in mashup are not working properly. (VZB-1085)
2.4.3
2019-03-15
Resolved Issues
- Line chart is not rendering y axis dimension labels fully (some labels are cut off). (VSP-342)
2.4.2
2019-03-05
Resolved Issues
- Conditional Visibility expression option missing. (VSP-334)
- Line Chart Legends issue. (VSP-351)
2.4.1
2019-02-27
Resolved Issues
- Vizlib Line Chart x-axis dimension label cut off. (VSP-270)
- Data point symbols still show when measure visibility condition is not met. (VSP-242)
- Legend shows measures after they are hidden/deselected. (VSP-234)
2.4
2019-01-25
New Features
- Inherit line type from line in legend. (VZB-128)
Resolved Issues
- When there's not data available the line chart doesn't get update. (VSP-153)
- Hide duplicate alternate states. (VZB-481)
2.3.1
2019-01-14
Resolved Issues
- After applying "Show values" color should be auto. (VZB-210)
- Set default position value for show values. (VZB-212)
- Corrected minor conversion issues. (VZB-259)
2.3
2018-12-31
New Features
- Added more options to position the data values. (162639423, 162893406)
- added date time format and improved auto formatting. (162893294)
Resolved Issues
- calc cond expression message not applied. (161778633)
- linechart default format auto makes extension not render. (162168494)
- data points are directly on the line instead of slightly above the line and it makes it very difficult to read. (162581538)
2.2.2
2018-11-20
Resolved Issues
- Exporting a snapshot with selection doesn't render. (161503887)
- when PDF printing the entire sheet sometimes doesn't render all line objects. (162091393)
2.2.1
2018-09-03
Resolved Issues
- Fixed rendering issue on IE.
2.2
2018-08-26
New Features
- Added a new reference Object.
- Improved legend alignment. Added PDF printing support.
Resolved Issues
- Fixed donut chart value labels where the label was not correctly showing the total.
- When time aware was used sometimes on the left/right axis some extra margin was added.
2.1
2018-08-15
New Features
- Added stack mode in measures (independent per each axis).
Resolved Issues
- Dimension label was overlapping the axis in some occasions.
2.0.3
2018-07-26
New Features
- Fixed linechart pagination rendering issues when loading more than 2,500 data points.
2.0.2
2018-07-23
Resolved Issues
- Fixed minor formatting issues on the secondary axis.
2.0.1
2018-07-19
Resolved Issues
- Fixed number 'num()' formatting for measures.
- Fixed some minor typos on the property panel + enhanced color gradient UI.
2.0.0
2018-07-16
New Features
- Added a new coloring mode 'by Segment'. Where the line/area can be split by value or line %, in order to multicolour the same measure.
- Add ability to conditionally change the icon and font size dynamically by expression. Add ability to conditionally apply opacity and color (line/data points/markers) by expression.
Resolved Issues
- Fixed minor number formatting issues.
- Removed inconsistent options in the panel related to images that were causing javascript errors in some QS versions.
- Fixed some minor issues on the tooltip smoothness.
1.9.1
2018-07-06
Resolved Issues
- Tooltip was replacing spaces and other symbols with '_' on the tooltip labels. Tooltip has a smoother UX when hovering data points.
- Multi tooltip was not working in FireFox.
- Line opacity wasn't getting applied to data points (added data points opacity control). Added more margin to y-axis'.
- Minor formatting bug fixes regarding the number formatting for the axis.
1.9
2018-07-04
New Features
- Increased number of max allowed measures to 20.
1.8
2018-05-04
New Features
- Added ability to control the color of the line by expression or dimension (available when 2 dimensions and 1 measure are used in the chart).
1.7.2
2018-04-16
Resolved Issues
- Fixed conflict between non-time aware axis and y-ref lines.
1.7
2018-03-23
New Features
- Added vertical reference lines.
- Added border and background color styling on reference line labels.
1.7.1
2018-03-03
Resolved Issues
- Fixed time-aware y-reference lines.
- Line highlighting on hover would not pick the correct line sometimes. Improve tooltip behavior and responsiveness.
- Dimming down of other trend lines would not work.
- y-Axis would sometimes get lost when only 1 dimensions value was selected.
1.6.3
2018-03-09
Resolved Issues
- Fixed collisions with Scatter and Heatmap. Opacity bug on the line chart when hovering.
- Conditional show and hide was not hiding the data labels. Fixed several bugs around the tooltip.
1.6.1
2018-02-21
New Features
- Alternate States.
1.5
2018-02-12
New Features
- Ability to add a custom text prefix/suffix to your y-axis formatting like currencies and more Control the number of data points loaded and loading more than 10,000 records.
Resolved Issues
- Highlighting is automatically suppressed if you only have one line. Min/Max y/y2 values were in some cases not working as intended.
- Property panel was sometimes throwing API errors due to expressions format being required in some settings. Expressions have now been set as optional.
- Color picker for reference lines was not working. y2 axis tick was overlapping the dimension title.
1.4.4
2017-11-13
Resolved Issues
- Wrong Weekday in time aware chart.
1.4.3
2017-10-26
New Features
- Sticky tooltip in single mode.
1.4.2
2017-10-25
New Features
- Compatability with Qlik Sense November 2017.
1.4.1
2017-10-22
New Features
- Position horizontal reference line text on the right outer chart area.
- Ability to turn the Vizlib Line Chart into read-only (not selections possible).
Resolved Issues
- High and lowlighting of lines were not working in IE - this has been fixed.
- Single tooltip would cut-off when selecting data points near the chart borders. The tooltip will now be re- positioned if close to the edge.
- A metric consisting of null values only would break the chart - this has been fixed, and the line will disappear altogether.
- Pie and Donut mode is now working also when x-axis is time-aware.
- Reference line was breaking if decimal separator of its value was a comma (,). This has been fixed.
1.4
2017-10-16
Resolved Issues
- Fixed issue where Vizlib Line Chart would not display on a mashup hosted on a server other than Qlik. Legend does not re-render when show/hide condition is updated.
- Conditional show/hide of the chart is now functioning.
- y-Axis ticks were sometimes cut off when dimension title was hidden. This is fixed. Accumulate Values Settings would not appear checked even if the settings were active. Tooltip is now working in IE11 (single mode only).
1.3.2
2017-10-12
Resolved Issues
- Horizontal Reference Line was not dynamically updating with selections.
1.3.1
2017-10-02
Resolved Issues
- Fixed issue where trend lines would not disappear if deselected.
- Bug with overlapping labels when using multiple metrics has been fixed.
- Chart does not crash anymore when converting back to a native Qlik Sense Line Chart.
1.3
2017-09-25
New Features
- New Trend Lines available.
- Consistent Colors - select this if lines colors are fixed on their dimension value. Different Tooltip behaviours (stick/fixed/ centered) to avoid overlapping.
- A tiny vertical guideline was introduced with the Tooltip.
Resolved Issues
- Fixed bug where the extension would stop working if there were no data to display. Fixed an issue where tooltip would display wrong value if null().
1.2.4
2017-08-06
Resolved Issues
- Axis Ticks wouldn't show when dimension is not time-aware. Horizontal Gridlines are now compatible with a secondary axis.
- Bug Fixe where sometimes the line would duplicate itself when resizing the charts.
1.2
2017-05-28
New Features
- Rich Grid Line Formatting introduced. Legend now supports for multiple Metrics too.
- Null handling has been improved. If a record is missing on the x-axis, the line chart will produce a gap.
Resolved Issues
- Fixed bug with Background Coloring.
1.1
2017-05-14
New Features
- Split-second dimension by Pie or Donut Chart. Image as Data Points.
- Conditional Show/Hide of Measures. Rich formatting option.