Properties - Data and Data Handling
The Data menu contains settings for the Dimensions and Measures used in Vizlib Scatter Chart. You can find an example of how to use dimensions and measures to create a scatter chart in the setup article here.
This topic contains the following sections:
Dimensions
Vizlib Scatter Chart supports up to two Dimensions (Figure 1).
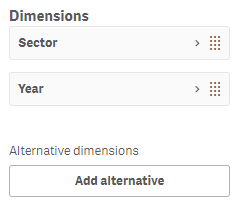
Figure 1: Dimensions
-
Dimension 1 is required to display the visualization.
-
Dimension 2 can be added to display the historical tracking trails of a dimension over time, so it needs to be a timestamp.
Note: If you decide to add a second dimension, please ensure there are no gaps in time values, and the dimensions all have 100% data density.
The dimension settings (Figure 2) allow you to edit the display Label, Include null values, and set a Limitation on the display values: a Fixed Number, an Exact Value, and a Relative Value.
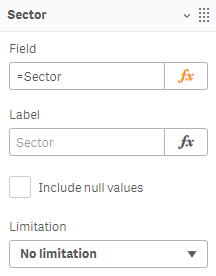
Figure 2: Dimension Settings
You can also enable Markers for dimensions (Figure 3), to help visualize the data points on the scatter chart. You can choose between three types of Representation: a Symbol (select from a list), an Icon (select from a list of > 700 icons, or upload your own) and Image (add an image using a URL or the Qlik Sense content editor). You can also control the Symbol Size, and Symbol Opacity.
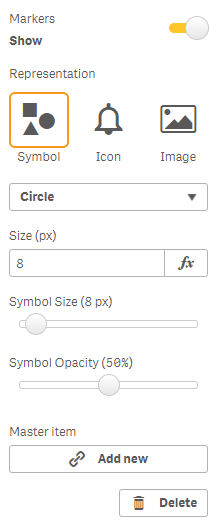
Figure 3: Dimension Markers
Measures
Vizlib Scatter Chart supports up to three Measures (Figure 4).
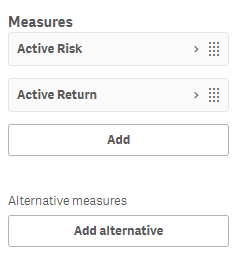
Figure 4: Measures
-
Measure 1 is mandatory and displayed along the x-axis.
-
Measure 2 is mandatory and displayed along the y-axis.
-
Measure 3 is optional and determines the bubble size.
The measure settings (Figure 5) allow you to edit the display Expression, and control the Number formatting by selecting from a list of options and choosing between a Simple format or a Custom format (where you enter your own values). You can also choose to add a new Master item.
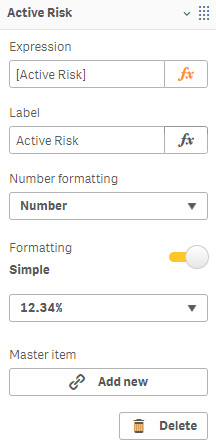
Figure 5: Measure Settings
Data Handling
Data Handling (Figure 6) controls allow you to set Data Limits, Suppress Zero Values, and enter a Calculation condition to show a Displayed message when the calculation is met.
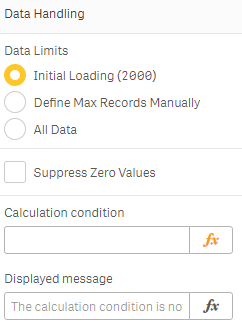
Figure 6: Data Handling