Vizlib Table Changelog
The following software changes were introduced to Vizlib Table:
3.28.4
2025-07-10
Updates
-
insightsoftware has introduced warning messages that inform users about size limitations on exporting formatted data to Excel. For more information, see Exporting Formatted Data to Excel under Limitations.
Resolved Issues
-
Resolved the issue where the file exported using Excel formatted export was too large. Currently, the file size is reduced by approximately one third compared to the previous size, depending on data structure.
-
Resolved the issue where the setting the background color for null value through column was not working.
-
Resolved the issue where formatting in Vizlib Table was not retained.
3.28.2
2025-05-26
Resolved Issues
- Resolved the issue with the incorrect data format after exporting Table to Excel using the formatted export option. (VIZ-22044)
Vulnerability Fixes/Updates
- To remove vulnerabilities, the Title Content property in the Property Panel > Data > Column > Header and the Cell tooltip property in the Property Panel > Dimension/Measure > Cells no longer accept scripts. (VIZ-22028)
3.28.1
2025-04-16
Resolved Issues
- Resolved the issue where incorrect URL opened when using Open URL action. (VIZ-21920)
- Resolved the issue where the Invalid Parameters error was displayed after filtering on null value in Vizlib Table. (VIZ-21943)
Rebranding
- The About Vizlib Table section of the Property Panel has been rebranded to reflect insightsoftware visual style. (VIZ-22007)
3.28.0
2025-03-20
New Features
- Vizlib Table supports Cyclic Dimensions. For more information, see Cyclic Dimensions. (VIZ-21840)
3.27.2
2025-01-20
Resolved Issues
- Resolved the issue where the formatting was missing after updating Vizlib Table to v3.26.0. (VIZ-21764)
3.27.1
2024-11-21
Security Improvements
- General security improvements. (VIZ-21404, VIZ-21681)
Resolved Issues
- The software did not display the settings in the Property Panel > Data section. Currently, the software displays the settings properly. (VIZ-21762)
3.26.0
2024-10-15
New Features
- Possibility to enable and disable formatted export in the Property Panel. For more information, see Enable or Disable Formatted Export. (VIZ-21512)
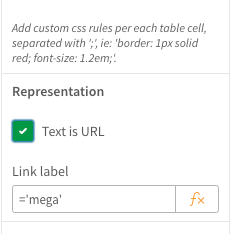
- You can change the way the links are presented in the Table if inserted as Dimensions. You can change the URL into text. To do so, in the Dimension properties, go to Representation and enable the Text is URL option. Once enabled, you can insert your own link text using the Link label field. (VIZ-21349)
Updates
- The extension loaders have been updated. The updated loaders don't interfere with your company branding. (Loaders)
- If there are no dimensions in the app, Vizlib Table Wizard displays the Measures tab first, and then the Fields tab. If there are no measures, the Fields tab displays first. (Table Wizard)
Resolved Issues
- When the users created a master dimension and wanted to drag and drop the field into the table. the field wasn't inserted, but the master item worked correctly. Currently, the master dimension is inserted properly into the table. (VIZ-21589)
3.25.2
2024-08-01
Updates
- The following changes on the user interface (UI) have been made in this release:
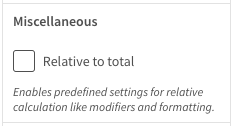
- The Relative to total option is located in the Miscellaneous section on the Properties Panel.
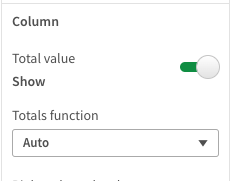
- The Show total value checkbox has been replaced with a switch with the Show and Hide settings.
Note: The mentioned changes on the UI apply only to Vizlib Table v3.25.2 and onwards.
- The Relative to total option is located in the Miscellaneous section on the Properties Panel.
Resolved Issues
- When you exported formatted data, the colours, fonts, and borders set for the header, rows, and totals displayed incorrectly. (VIZ-13303)
- The number of exported rows differed depending on which of the three options you chose:
- Export Data to Excel
- Export Data to CSV
- Export Data to Tab Separated CSV
3.25.1
2024-07-03
Resolved Issues
- The Relative to total option did not work together with the MiniChart. (VIZ-14292)
- The columns and headers displayed incorrectly when the users changed data structure. (VIZ-13349)
3.25.0
2024-07-01
Updates
- Nprinting report keeps the design of Vizlib Table. (VIZ-8982)
Resolved Issues
- After the users exported Vizlib Table in .xslx for Nprinting, the columns had an invalid color. (VIZ-13934)
- The measures inside the generated Qlik NPrinting report had black bakground. (VIZ-14133)
- After the users exported data from the chart, the "-" symbol was displayed in blanks. (VIZ-21188)
3.24.0
2024-06-12
Updates
- Nprinting report keeps the design of Vizlib Table. (VIZ-8982)
Resolved Issues
- When the users used a variable in the Master Font Color, the text in the table changed to white after hovering on it. The color did not change back to the original color and, as a result, the text was invisible if no background color was set. (VIZ-13715)
- The Totals column was missing after the users exported data to Excel. (VIZ-13341, VIZ-13476)
- The values in Totals horizontal line did not update properly after the users changed the column order. (VIZ-13766)
3.23.5
2024-04-23
Resolved Issues
- The export option in Excel failed when fields were hidden. (LIB-13829)
- The formatted data exported into Excel did not work as expected. (LIB-13822)
- The representation icon (arrow) was no longer visible when any change was made. (LIB-13715)
- When the sheet was embedded in Qlik or the Vizlib container, data was not visible when the user exported the sheet to PDF. (LIB-13684)
3.23.4
2024-03-06
Resolved Issues
- Filter pop up inconsistencies. (LIB-13631)
- Export formatted data to Excel in Qlik Saas ignores time formatting. (LIB-13649)
- Mini Chart format/height is not working as before. (LIB-13650)
- Export to Excel is not keeping the date format. (LIB-13664)
3.23.3
2025-02-22
Resolved Issues
- Resolved the issue with the incorrect data format after exporting Table to Excel using the formatted export option. (LIB-13638, LIB-13644)
3.23.2
2023-12-11
Resolved Issues
- Excel export icon not visible in native Qlik container. Exporting using the quick export feature was not appearing in the Qlik container. (LIB-13457)
- Incorrect total label presented in formatted exports. (LIB-13256)
3.23.1
2023-10-11
Resolved Issues
- Improved error handling for Viztips. In some situations on resize the error VZB001 would break the rendering. (LIB-13229)
- Viztips does not display correctly or at all. Viztips would not appear correctly in combination with maximized objects. (LIB-12818)
- Viztips is not visible when we have KPI Designer with template on the same sheet. When using a KPI Designer with a template on the same sheet as a Viztip the Viztip would not appear. (LIB-13176)
- Cannot copy Header cell values. It was not possible to copy the cell value of a header cell. (LIB-13099)
- Whitelist Custom Report to be allowed to display the export icon. The small icon included in table for exports did not display in Custom Report. With these changes and changes in Custom Report it will now work. See changelog for Custom Report for more details. (LIB-13230)
- Vizlib Table non-formatted exports removes null values. When exporting data to Excel/CSV, a row containing a null value was not being exported. Formatted export worked as expected. (LIB-13094)
3.23.0
2023-09-27
New Features
- Actions for Vizlib charts when using Alternate states. When making actions whilst using Alternate states for Vizlib charts, you will now see a new section within the following actions (see list below image). This will control the Action to apply it's action to a determines Alternate state.
When Alternate state is defined as <Default state> that will apply to all charts that have no Alternate state applied to them.
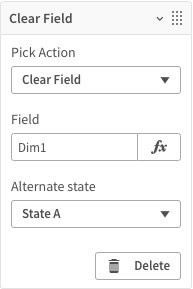
List of Actions that have Alternate states assigned to them:
- Unlock all (Unlock all selected) Clear all
- Unlock and clear all
- Lock all (Lock all selected)
- Clear field
- Unlock field
- Select possible
- Select alternative
- Select excluded
- Lock field
- Selection in field
Note: We are rolling this out for other charts. To ensure you're getting the latest features, please keep the extensions upgraded.
Resolved Issues
- Column Deletion is not reflected on the Table. When trying to delete a column from the Vizlib Table, the column is removed from the data but not on the visualisation itself. (LIB-12942)
- Scrolling hid mini charts. When you have several columns with a measure representation of Minicharts, scrolling stops the Minicharts from showing up. (LIB-12860)
3.22.3
2023-09-07
New Features
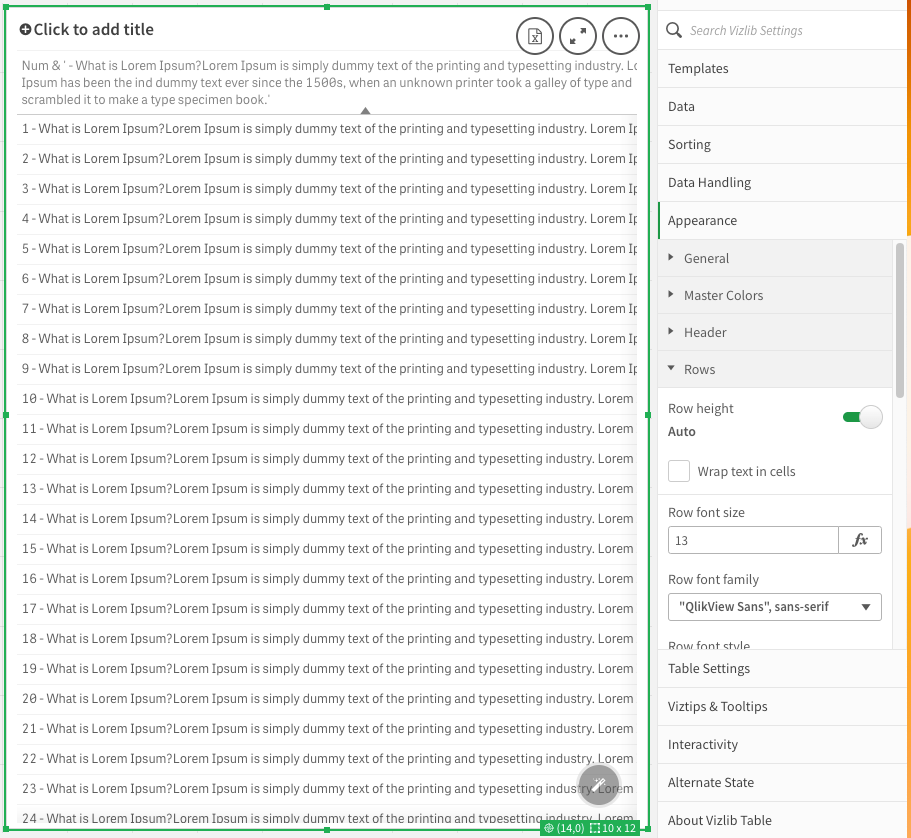
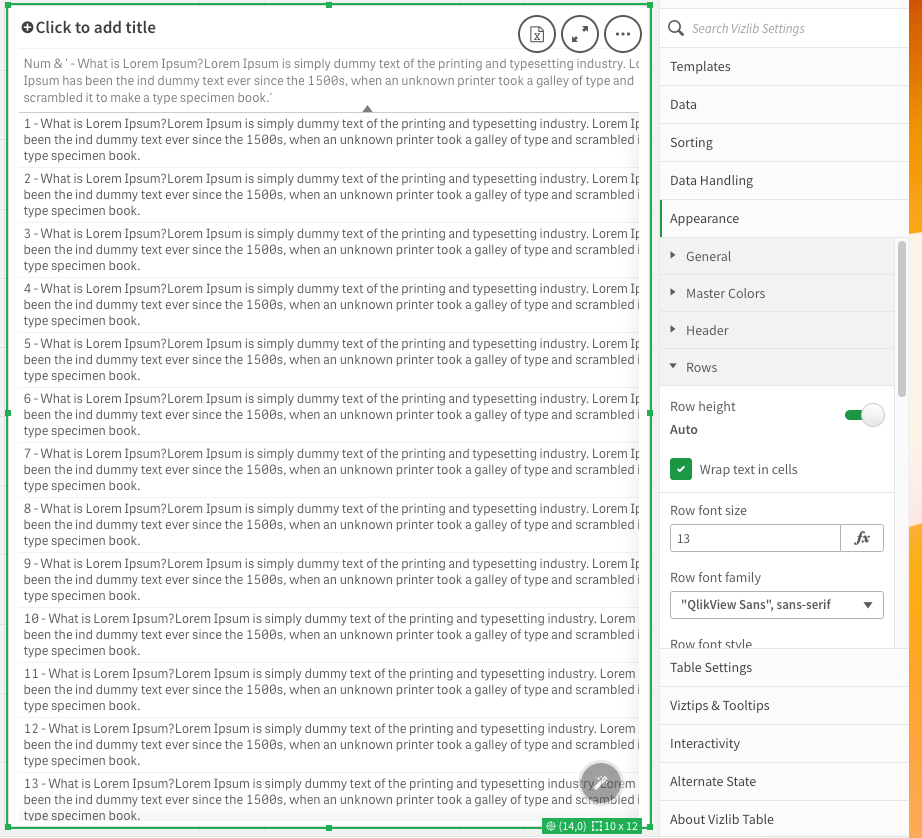
- Wrap text mode for measure\dimension field. In the Vizlib Table's property panel > Appearance > Rows > when Row height is set to Auto, the option 'Wrap text in cell' will wrap the text in the Table's rows. (LIB-8895)
- Column misaligned with headers when using different window sizes. When changing the view size of the Vizlib Table, the column headers would become misaligned. (LIB-12986)
- Text is cut-off when auto-height is used. You can now set the 'Min row height' for your Vizlib Table. (LIB-12434)
3.22.2
2023-06-14
Resolved Issues
- Incorrect Number Format when using Formatted Export.
Using the formatted export option for the Vizlib Table determines the thousand and decimal separators based on the user settings from their computer.
In this release we pass the information over to Excel and let Excel determine the correct separators based on the user's settings.
As a result of this, when sending files from different countries, Excel will show the user their separator symbols as this is now determined by Excel. For example:
UK
Thousand = ' , ' (comma)
 Decimal = ' . ' (point)
Poland
Thousand = ' ' (space)
Decimal = ' . ' (point)Sweden
Thousand = ' ' (space)
Decimal = ' , ' (comma)Note: This does mean that your user may download file which does not look like what they see on the Qlik Sheet. This is because the Vizlib Table respects the defined separator symbols in the Qlik Load Script.
3.22.1
2023-05-16
Resolved Issues
- Recalculation of Table on Selection. Table performed recalculations every time a selection was made. (LIB-12146)
- Horizontal Scroll bar reverts to first column when trying to use the Vertical Scroll. When scrolling the table using the horizontal scrollbar and then clicking on the vertical scrollbar, the horizontal scrollbar resets. (LIB-12492)
- Indicator in Totals won't respect the actual color if color is loaded via DLE. When specifying a color in the indicator property then the colors are displayed correctly. However, if a variable is used to define the colours then inconsistencies would occur in the Totals row. (LIB-12432)
- Unable to view the export options in Qlik SaaS Government. When trying to right-click on the Container Grid in the Qlik SaaS Government environment, customers don't see the Export option for the Vizlib Table within. (LIB-12435)
- Export formatted data to Excel doesn't keep all the formats. When you export the formatted Vizlib Table with the option "Export Formatted Data to Excel", not all formats are kept. (LIB-12375)
3.22.0
2023-04-04
New Features
- Indicator Range. We have made a significant improvement to our indicator range. Now you are able to define specific indicator ranges that you can use to highlight your table data based on the criteria you set out. By going to a Measure column, find the Indicators option and define your indicator ranges with. (LIB-12103)

- Improved scroll mechanic. We are constantly looking at ways to improve our products and being able to seamlessly navigate your Vizlib Table is important. This is why we invested the time to improve our scroll mechanic to provide our Customers and Users with a better experience. (LIB-12053)
3.21.2
2023-05-13
Resolved Issues
- Mashups hosted on standalone server throws Windows Authentication error. When using the Vizlib Table in a mashup, "Windows Authentication" console log errors are displayed. (LIB-12234)
- SaaS - Quick export button is not rendering/isn't displayed. The permission check for displaying the Quick Export Button ('Show Export Icon' in the property panel) so we have added a button which will always display the icon. Please read the information below.
- If the checkbox is NOT selected = False (default option), Export to Excel icon will be visible only to users withrelevant export permissions.
- If the checkbox is selected = True, Export to Excel icon will be visible to all users no matter what permissions they have been assigned.
- SaaS - Colored background on the exported file if using a dark template. Exporting the Vizlib Table would result in a dark background on the Excel export even if you have no formatting. (LIB-12008, LIB-12206)
3.21.1
2023-01-27
New Features
- Exporting formatted data not working as expected. Exporting using the Table when you had an expression which hid the data [ =if(field = true, '', field) ] the table would still export some data. This has been fixed to ensure the Table respects your properties. (LIB-11935)
- Sorting is not kept when exporting to Excel if Vizlib Table is Master Visualization. In the Vizlib Table you can click on the header (column) to sort the data. If you use this option and export the data the sorting will be kept. However, if the Vizlib Table is a Master Visualization, then exporting the data will keep the original sorting, regardless of what sorting you have selected from clicking on the header (ASC/DESC). (LIB-11840)
- Search icon isn't displayed in Mashup when getting objects from multiple apps. You can now filter dimension's column values on tables that come from different apps within your Mashups. Before this fix you could only filter these dimension's column on the first loaded table, meaning any other table that references another Qlik Application would not respect the search functionality. (LIB-11762)
Resolved Issues
- "Quick export" is not handling security rules of Qlik Sense. The 'Quick export' now respects your Qlik environment's security rules. So if you have users who are not allowed to export then this option will not appear for them. (LIB-11926)
3.21.0
2022-11-29
New Features
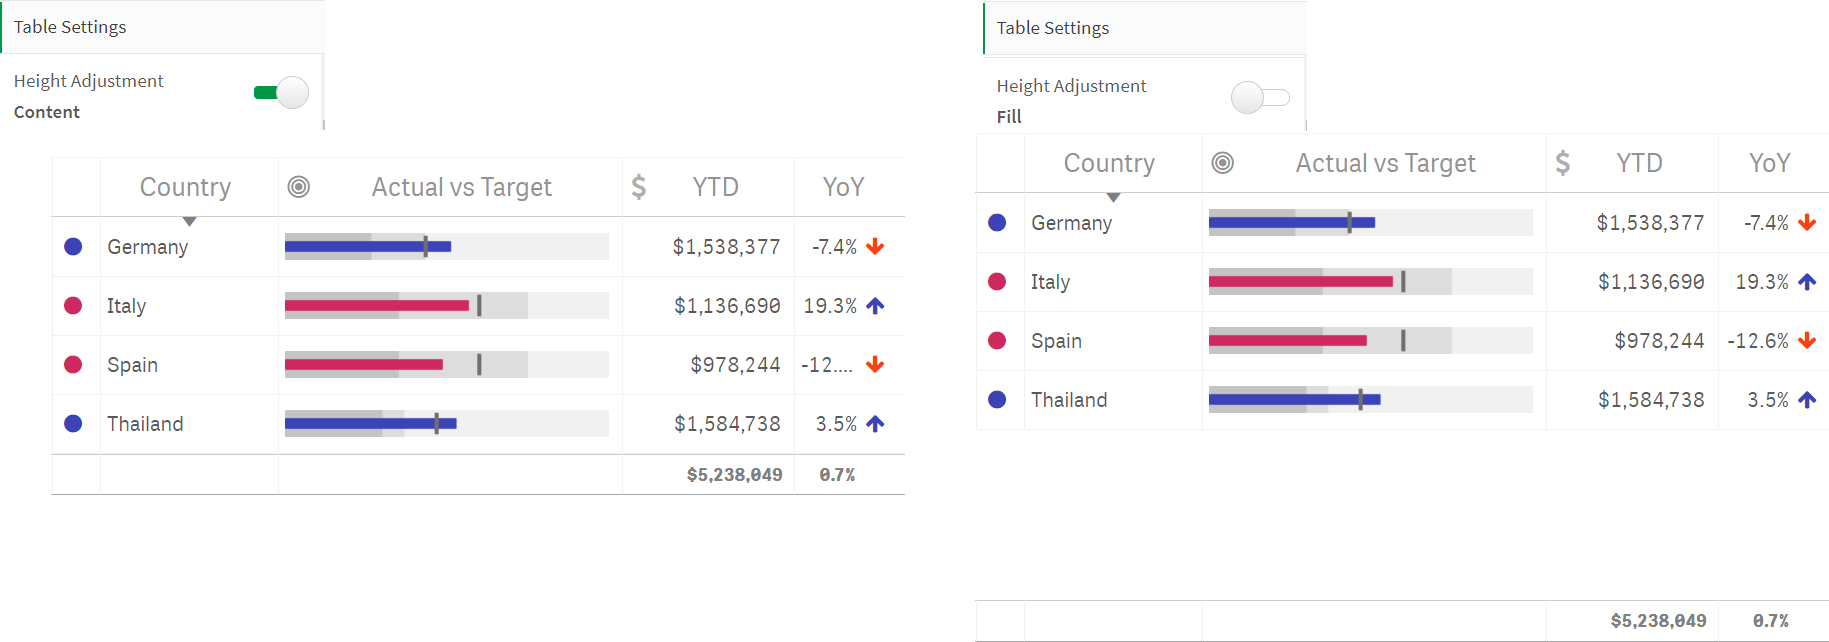
- Static or dynamic total position. It is now possible to control if totals sit as the last row or at the very bottom of the table. When the Table is set to adjust the size after the content the total will be the last row (right after the rows of data). When it is set to fill it will position the total at the bottom. (LIB-9210)
Resolved Issues
- Image export using 3rd party printing service isn't working as expected. This fix should help with exports from Mail & Deploy. Note that the most recent version of that software is also needed. (LIB-11339)
- Blank space between the rows on NPrinting. Relate to the new feature above. Totals should now also be in the correct position when printing. (LIB-11577)
- PDF and NPrinting Shading on Table. An unwanted shading was accidentally added. (LIB-11675)
- Misaligned columns. The table would in some situations get misaligned columns. (LIB-11658)
3.20.1
2022-09-20
Resolved Issues
- TABLE: Hidden Column data is only data available when searching the column to the right of it. (LIB-11478)
- Vizlib Table - Invalid Hypercube Object State upon selecting Measures. (LIB-11440)
- Vizlib Table: data is constant whatever the selections. (LIB-11476)
- TABLE - In formatted excel data export, columns are shifted around. (LIB-11451)
3.20.0
2022-08-01
New Features
- Colours In Mini Chart Pie Charts Incorrect. (LIB-11174)
- Support Formatted Export to XLSX on the Cloud. (LIB-11164)
Resolved Issues
- Formatted Excel export - disabled columns shifts column alignments of subsequent cells. (LIB-11326)
3.19.1
2022-06-30
Resolved Issues
- Vizlib Table inconsistent display on Nprinting reports. (LIB-11253)
- Export to PDF from Vizlib Table is giving blank output. (LIB-11248)
- Application response is very slow when Vizlib table is used in the application. (LIB-11124)
- Conversion of Pivot Table v3.3.3 to Table v3.18.6 displays incorrect data. (LIB-11180)
- VL Table- Incorrect Formatted export format. (LIB-11209)
3.19.0
2022-06-01
New Features
- Update to API Call. (LIB-11189)
3.18.7
2022-05-23
Resolved Issues
- Duplication rows in excel after export Table to excel. (LIB-11083)
- Export as Values displays the custom format expression in the exported file. (LIB-11120)
- Vizlib Table values in Qlik Stories not being displayed. (LIB-11039)
3.18.6
2022-04-19
Resolved Issues
- Bug with Table (Cannot read properties of undefined). (LIB-10937)
3.18.5
2022-02-25
Resolved Issues
- Table Hangs on Export. (LIB-10902)
- Borders Display on Scrolling. (LIB-10491)
- Progress Bars Display. (LIB-10908)
3.18.4
2022-02-15
Resolved Issues
- Wrong Display of Negative Values. (LIB-10903)
3.18.3
2022-02-10
Resolved Issues
- Hyperlink is Broken. When using A URL that is different than HTTP or HHTPS, the link isn't clickable. (LIB-10583)
- Export of Merged Cells. (LIB-10517)
- Numeric Abbreviations. (LIB-10706)
- Line Mini-Chart Display. (LIB-10685)
- Mini-Chart Display. (LIB-10609)
3.18.2
2021-12-16
Resolved Issues
- Formatted Export Error. (LIB-10628)
- Indicators Display for Null Value. (LIB-10595)
- Table Image Display in Nprinting. (LIB-10680)
3.18.1
2021-12-09
Resolved Issues
- Formatted Export is Missing Records. (LIB-10638)
3.18.0
2021-12-03
New Features
- Minicharts Height. (LIB-10541)
Resolved Issues
- Mini Chart Display. (LIB-10330)
- Mini Line Chart Display. (LIB-10393)
- Table Flicker. (LIB-9154)
- CSS Styling Not Working. (LIB-10418)
3.17.4
2021-10-13
Resolved Issues
- Quick Selections Behavior. (LIB-10162)
- Viztips Display. (LIB-10060)
3.17.3
2021-08-31
Resolved Issues
- Tooltip with complex expression. (LIB-9952)
- Export Data Columns Order. (LIB-9671)
- Column Borders Alignment. (LIB-9401)
- Export Formatted Data. (LIB-9732)
3.17.2
2021-08-09
Resolved Issues
- Dimension Background Color. (LIB-9577)
- Null Value Default Color. (LIB-9649)
- Mini Chart Display. (LIB-9653)
3.17.1
2021-07-29
Resolved Issues
- Context Menu Inside Containers. (LIB-9686)
- Corrupted File. (LIB-9682)
3.17.0
2021-07-12
New Features
- Context Menu Enhancements. (LIB-9432)
- Copy Cell Value. (LIB-9543)
Resolved Issues
- Export Formatted Data To Excel. (LIB-9562)
- Template Not Applied. (LIB-9573)
- Sorting Icon Display. (LIB-9394)
3.16.9
2021-06-22
Resolved Issues
- Export Data In Qlik Sense May 21 Version. (LIB-9332)
- Cell Tooltip Display. (LIB-9297)
3.16.8
2021-06-15
Resolved Issues
- Incomplete Table export to PDF. (LIB-9369)
3.16.7
2021-05-21
Resolved Issues
- Vizlib Table - Formatted Export throws a Error message. (LIB-9135)
- Open URL works on Vizlib Button but not on Vizlib Table. (LIB-9164)
3.16.6
2021-05-10
Resolved Issues
- Header Row Height. (LIB-9100)
3.16.5
2021-04-26
Resolved Issues
- Table Scroll bar Inside Container. (LIB-8836)
3.16.4
2021-04-02
Resolved Issues
- Color of Selected Values. (LIB-8786)
- Resize of Column Width in Master Item. (LIB-8737)
- Display of Rows During Selection is Limited. (LIB-8778)
- Selections in Field Action. (LIB-8718)
- Open URL Action in Qlik Cloud. (LIB-8611)
3.16.3
2021-03-04
Resolved Issues
- Table version 3.16.2 Icons appear on table title. (LIB-8738)
3.16.2
2021-03-02
Resolved Issues
- Selections are Active in Read Only Mode. (LIB-8694)
- Null Values Don't Appear in Initial Display. (LIB-8672)
- Dimensions Display Order. (LIB-8470)
- Selections are Active In Dimension Read Only Mode. (LIB-8613)
- Export total row in Image. (LIB-8623)
3.16.1
2021-02-08
Resolved Issues
- Total Indicator Display. (LIB-7951)
- Actions in Pinned Dimension. (LIB-8392)
- Export Icon in Container Grid. (LIB-8243)
- Vertical Scroll Bar. (LIB-8315)
3.16.0
2021-01-28
New Features
- Support for Complex Expressions in Mini-Charts. Minicharts now support expressions with multiple parts and set analysis in all parts of the expression. (LIB-8110)
Resolved Issues
- Navigate Action in Dimension Doesn't Work. (LIB-8244)
- Wizard Button Console Error. (LIB-7972)
- Export as TSV File. (LIB-8252)
- Mater Measure Console Error. (LIB-7973)
- Hover Highlight On Null Value Cells. (LIB-8121)
- Calculate Column Section. (LIB-8194)
- Scroll Bar in Firefox. (LIB-8055)
- Multi-Select Action Limitations. (LIB-8106)
3.15.0
2020-11-30
New Features
- New Table Setup Wizard. (LIB-7292)
Resolved Issues
- Null Values Cell Display. (LIB-7906)
- Export Formatted Data Error. (LIB-7862)
- Export Formatted Error. (LIB-7843)
- Table Wizard Error. (LIB-7410)
3.14.0
2020-11-25
New Features
- Disable Selections In Measure. (LIB-3535)
- New Mini Chart- Control Chart. (LIB-7391)
- Define a range area to be added to your mini line chart.
Resolved Issues
- Formatted Export Error. (LIB-7411)
- Export Button on Mashups. (LIB-7399)
3.13.0
2020-10-09
New Features
- New types of minicharts. (LIB-7034)
- Fast Export support in mashups. (LIB-6992)
- Links export support. (LIB-5951)
Resolved Issues
- Tooltip Display Stuck. (LIB-6624)
3.12.2
2020-09-15
Resolved Issues
- Vizlib Table -Extra space displayed after the last column. (LIB-6878)
- Mini chart displays only one bar for 0 values. (LIB-6719)
- Incorrect total label presented in formatted exports. (LIB-6793)
- Right Column Border does not display and is overridden by the scrollbar. (LIB-6851)
- "Use Same Start Date" caused mini-chart bars to become negative and with a different sorting order. (LIB-6762)
3.12.1
2020-09-10
Resolved Issues
- Vizlib Table - Merged Cells option formatting changed. (LIB-6926, LIB-6602)
- VizLib Table- Column Headers missing in Formatted Data export. (LIB-6828)
- In Chrome expanding Vizlib Table causes it to Freeze on full screen. (LIB-6590)
- Vizlib Table - Tooltip display goes off-screen in Analysis mode. (LIB-6686)
3.12.0
2020-09-08
New Features
- Viztips in Vizlib Table. (LIB-6440)
3.11.0
2020-09-02
New Features
- Add checkbox to "show indicator in totals row". (LIB-6227)
- Option to Include Selections & header, subtitle, Footer in formatted Export. (LIB-5554)
Resolved Issues
- Vizlib Table Tooltip Stuck When Linking to Separate Sheet. (LIB-6624)
3.10.0
2020-08-28
New Features
- Table export button. (LIB-6699)
3.9.3
2020-07-28
Resolved Issues
- Duration Data Type not showing formatted value on the bullet chart tooltip. (LIB-6147)
- Not able to reorder columns if table is as master item. (LIB-5563)
3.9.2
2020-07-13
Resolved Issues
- Vizlib table ' Text is Url' not working correctly. (LIB-5925, LIB-6345, LIB-6101)
- Vizlib Table Bullet chart representation showing up as Black. (LIB-6245)
- Search field sometimes becomes unresponsive when Table inside Qlik Container. (LIB-6112)
3.9.1
2020-07-06
Resolved Issues
- Repeating Data on the Vizlib Tables. (LIB-6361)
3.9.0
2020-06-30
New Features
- New mini-chart representations. (LIB-6270)
3.8.0
2020-06-15
New Features
- Improved property panel user experience. (LIB-5490)
Resolved Issues
- Export in EXCEL with null values. (LIB-5987)
- Advanced CSS Styling not applied to first column. (LIB-5903)
- Drop down minimizes ignores "Hide Dropdown after Selection" option. (LIB-5689)
Improvements
- Vizlib Table no longer freezes calculation when Qlik Engine computation too heavy. (LIB-3720)
3.7.5
2020-04-27
Resolved Issues
- Formatted export to excel row height is too large. (LIB-2494)
- Cell text color is reset to default color. (LIB-5421)
3.7.4
2020-04-07
Resolved Issues
- Not able to reorder columns in mashups. (LIB-5245)
- 'Text is URL' option stopped working. (LIB-5182)
Improvements
- Vizlib Table no longer freezes calculations due to variable update. (LIB-3720)
3.7.3
2020-04-03
Resolved Issues
- "Access is denied" error pops up when using tables in published apps. (LIB-5447)
3.7.1
2020-03-25
Resolved Issues
- No Scrollbars on Vizlib Table in macOS Firefox 72.0.2. (LIB-4881)
- 'Text is URL' option stopped working. (LIB-5182)
3.7.0
2020-03-20
New Features
- Property Panel Search. (LIB-5303)
- Vizlib Templates. (LIB-3193)
3.6.7
2020-02-19
Resolved Issues
- Not all data is displayed in formatted exports. (LIB-3935)
- Blank Table in Story Export. (LIB-4125)
- Calculated dimensions with variables displayed incorrectly. (LIB-4897)
- Qlik Sense November 2019 Icon Compatibility. (LIB-3305)
3.6.6
2020-01-30
Resolved Issues
- Exporting the Vizlib Table to excel causes redirect/auth window when custom proxy is in use. (VSP-1216)
3.6.5
2020-01-14
Resolved Issues
- On IE last row not visible after scrolling. (VSP-993)
- Story export working intermittently across various configurations. (VSP-927)
- "Invalid Parameters" when using Activate Sheet action on Dimension. (VSP-985)
3.6.4
2019-12-16
Resolved Issues
- Mini Chart is blank with some Set Analysis syntax. (VSP-1034)
- Console error after selecting any option from "Representation" module and adding table to master item / Container. (VZB-2263 and VZB-1919)
3.6.3
2019-10-24
Resolved Issues
- Minicharts sensitive for filters (even with set analysis used). (VSP-718)
- Export is incorrectly formatted when a column is hidden. (VSP-939)
3.6.2
2019-10-08
Resolved Issues
- Show Total not working when using Progress Representation. (VSP-865)
- Dragging outside of the table area triggers an error message. (VSP-715)
- Table snapshot shows current selection instead of snapshot/bookmarked selection in story. (VSP-627)
- Rows missing in "Export Formatted Data to Excel". (VSP-922)
- Set analysis was not working with minicharts (previously not supported). (VSP-718)
3.6.1
2019-09-19
Resolved Issues
- Icons missing in Qlik Sense September 2019. (VZB-2155)
3.6.0
2019-09-03
New Features
- Vizlib Actions - Add option to evaluate actions for each row. (VSP-719)
Resolved Issues
- Enabling merged cells applied hover styling to table. (VSP-797)
- Formatted export styling & layout issues. (VZB-1921)
- Minichart in table auto axis scale is incorrect when a single value is selected. (VSP-543)
- Total values disappeared for indicator representation type. (VSP-780)
- Negative values appear with parenthesis instead of minus sign. (VZB-1948)
- VizlibTable is not working in the Qlik Desktop Client. (VZB-1924)
3.5.0
2019-08-07
New Features
- Introduce Formatted XLSX Excel export in Vizlib Table. (VSP-132 and VSP-602)
- Custom Bulletchart colors per row. (VSP-338)
Resolved Issues
- Total header missing after switching column representation between non-text types. (VSP-547)
- Some text alignment settings shows table values out of visible area when "merge cells" setting enabled. (VSP-699)
- Format lost when switching between "Relative to total". (VSP-676)
3.4.3
2019-07-18
Resolved Issues
- Moving conditional measures applies in unexpected areas. (VSP-678)
3.4.2
2019-07-12
New Features
- Merge cells where dimension values are duplicated. (VZB-1620)
- Add options for vertical borders customization. (VSP-592)
- "Select all from Table" check box inside the Vizlib Table wizard REPLY ON FORUM. (VSP-616)
Resolved Issues
- Selections not rendering in table search dropdown when multiple apps are used. (VSP-639)
- VizLib Table won't export values that are hidden. (VSP-477)
- Vizlib Table mini (line) chart - data points not visible. (VSP-381)
- Vizlib Table - Minichart data value tooltip number not formatted. (VSP-395)
3.3.5
2019-07-05
Resolved Issues
- Vizlib Table sometimes produces an inconsistent NPrinting output (partially rendered). (VSP-504)
3.3.4
2019-06-28
Resolved Issues
- Vizlib Table inconsistent NPrinting output (partially rendering). (VSP-504)
3.3.3
2019-06-27
Resolved Issues
- Negative Number formatting fixed after upgrade. (VSP-620)
- Dragging fields in the wizard blocked by message. (VSP-641)
3.3.2
2019-06-24
Resolved Issues
- Error shown inside null cell. (VSP-621)
3.3.1
2019-06-19
Resolved Issues
- Qlik Sense June 2019 support. (VZB-1489)
3.3.0
2019-06-14
New Features
- Performance improvement due to condensation of expressions. (VZB-1417)
- Create table wizard (similar to the Vizlib Pivot Table Wizard). (VZB-1343)
- "Auto" Number format support. (VZB-913)
Resolved Issues
- Extension conflicts with bootstrap classes in mashup causing gap in table. (VSP-366)
- Vizlib Table search icon pushed into border on mouse hover / pin. (VSP-533)
- Vizlib Table mini line chart - data points not visible. (VSP-381)
- Vizlib Table conversion from bar/line chart has issues. (VSP-443)
3.2.0
2019-05-10
New Features
- Introducing presets for the Vizlib Table Bug Fixes. (VZB-867)
- Qlik Sense April 2019 Support. (VZB-1229 and VZB-1220)
3.1.8
2019-04-09
Resolved Issues
- Table Measure Tooltip not evaluating expression. (VSP-365)
3.1.7
2019-03-11
Resolved Issues
- Measure&Dimension Tooltip Value not evaluating expressions (requires re-adding column). (VSP-358, VSP-365)
- Implemented sync actions. (VZB-829)
3.1.6
2019-03-04
Resolved Issues
- Extension conflicts with bootstrap classes in mashup. (VSP-279)
- missing title text color for measures when null is auto. (VSP-288)
3.1.5
2019-02-19
Resolved Issues
- Null cell background color. (VSP-225)
- Spacing inconsistencies in the table. (VSP-229)
- Total label not showing when column pinned. (VZB-405)
- Alternate row coloring not working in Convert to VizLib Table. (VSP-216)
- Export data doesn't take Alternate State into account. (VZB-693)
- Field Search doesn't take Alternate State into account. (VZB-691)
- Hide duplicate alternate states. (VZB-678)
3.1.4
2019-02-05
Resolved Issues
- bulletchart target expression is not visible in property panel. (VSP-199)
3.1.3
2019-01-31
Resolved Issues
- Export sort order issue when conditions are used. (VSP-180)
3.1.2
2019-01-30
Resolved Issues
- vizlib table was not working when created on the fly using visualisation api. (VZB-593)
- scrolling with mouse wheel now requires to hover over scroll bar. (VSP-173)
3.1.1
2019-01-29
Resolved Issues
- Export sorting is working only if there are no conditionally hidden columns. (VSP-171)
- Tooltip appears off-screen. (VSP-413)
- Sorting arrow doesn't change when header is clicked. (VSP-164)
3.1
2019-01-25
New Features
- Added vertical cell alignment. (VSP-101)
Resolved Issues
- Wrong totals when data limit on first dimension was used. (VSP-151)
- Horizontal scrollbar, even though there is enough place room for all rows. (VSP-96)
- Table does not take up space correctly. (VSP-164)
- The export sorting is working only if there are no conditionally hidden columns. (VSP-158)
3.0.1
2019-01-10
Resolved Issues
- Vizlib Table totals shift when you hide column visibility. (VZB-293)
- table html tooltip doesn't align when scrolling in a mashup. (VSP-134, VSP-121)
- fixed conflict console errors. (VZB-307)
- trend graphs position was changing after resizing browser window or scrolling. (161214406)
- Title Color & Background color doesn't accept expressions or variables. (162603258)
- Vizlib Table does not size to Data and does not display borders. (162393438)
- Sometimes the total row get disappear. (162407705, 162578337)
- horizontal alignment in headers doesn't always work. (160884379)
- resize column is in wrong position. (160829554)
- sorting arrow it's not aligned with header cell. (160458421)
- calc condition description was not evaluating expressions. (162557911)
- sparklines sorting issues. (162557943)
- sorting of rows when exporting to excel was not always correct. (162558089)
3.0.0
2018-12-18
New Features
- Added actions on columns. (162699927)
- add custom tooltips in cell level with HTML support per column. (162305140)
- Tooltip value on progress bar and cells. (157367612, 157847717)
- Improvements on property panel UX. (162704497, 162700070)
- add custom totals color and position. (162738706)
- add row border thickness per column. (162738713)
2.9
2018-12-10
New Features
- implement custom null coloring. (162267103)
2.8.1
2018-11-30
Resolved Issues
- resolved issues with the newly added feature show-if. (162236985)
- resolved issue with scrolls in mashup. (161951161)
- when changing the totals font size the total label was cut off. (161218475)
2.8
2018-11-09
New Features
- Field calculation condition (>=QS June'18) - deprecated feature. (161581662)
- hide non visible columns on the data export (>=QS June'18). (161838742)
- keep column order on data export. (161838844)
- add calc condition (data handling) expression message. (161778621)
2.7
2018-10-26
New Features
- Support for Printing to PDF. (161084088)
- on export don't export measures that are hidden. (161205264)
- Sorted column export. (161509396)
Resolved Issues
- progress bar with currency formatting generates two lines. (161261925)
- links in table should be relative. (160955564)
- Title background colour in vizlib table does not evaluate expressions. (161444138)
2.6
2018-09-27
New Features
- Added header & totals custom border styling.
- New Data representation type for the minicharts data points: Square [No ID] URL links works incorrectly if it doesnt start from http or https.
- Section access denied in QS Sept'18.
- Fixed some minor issues on header styling settings.
2.5.5
2018-09-12
New Features
- Added ability to control the border style and color.
Resolved Issues
- Hide border on the appearance setting wasn't working.
- Right click/context menu copy to clipboard wasn't working within the vizlib container. The header tooltips were not destroyed after hovering out in some scenarios.
- Fixed unable to select some particular cells within the table.
- Sometimes a dialogue was flicking (showing up and immediately hiding) in some version of IE.
2.5.4
2018-08-15
Resolved Issues
- Fixed IPad-offline mode rendering issue of on-premise version.
2.5.3
2018-08-09
Resolved Issues
- When a Master Item Vizlib Table created in a previous version of QS June'18 was opened in QSJune18 it showed an "Invalid parameters" popup.
2.5.2
2018-07-31
Resolved Issues
- Fix rendering issues on QS June'18 with virtual proxies.
2.5.1
2018-07-25
Resolved Issues
- When the table was using a MI dimension/measure that does not longer exist (removed), the table was not rendering.
- Fixed rendering issues with NPrinting, where in small data sets the table was not printing if the extension was already on the NPrinting cache.
- Improved performance and styling on column the drag and drop.
2.5
2018-07-17
New Features
- Added ability to control what dimensions are selectable or not by the end user.
- Added option to dynamically position Totals below the last row if no vertical scroll is visible (size to data total position).
- Added option to control the position of the horizontal scroll bar (size to data/bottom) Improved indicators threshold where now the expression can support a per cell calculations.
Resolved Issues
- Fixed issues with the latest version of iOS app in offline mode Fixed duplicate rows behaviour in some edge scenarios.
2.4.6
2018-07-05
Resolved Issues
- Some dimension&measure styling attributes were not working when converting the table from the native QS table.
- Fixed compatibility with QS 3.1 suite enterprise.
- Header arrows were missing after converting the table in June'18.
- Minichart were not rendering on the first load in some scenarios where the table was created with a previous version from v2 of the Vizlib Table.
2.4.5
2018-07-03
Resolved Issues
- The column order was not correct when a measure was placed at first.
- When applying a selection over a mixed (order) table with columns and dimensions, the Qlik Engine was raising an error.
- Table was shifting columns in some scenarios.
2.4.4
2018-07-26
Resolved Issues
- Fixed compatibility with QS June'18.
- Fixed bug that was affecting mainly April'18 where the dimension search box was not showing up.
2.4.3
2018-06-13
Resolved Issues
- Fixed compatibility with NPrinting.
2.4.2
2018-05-31
Resolved Issues
- The horizontal scroll bar was not persisting the position after applying a selection in some scenarios.
2.4
2018-05-22
New Features
- Ability to control the font size for totals.
Resolved Issues
- Custom Font Family was not working for Headers/Rows. Drag & Drop was crashing when a column was hidden. Horizontal scroll could not be combined with drag & drop.
- Fixed issue where Alternate States would not work together with search.
2.3.2
2018-05-10
Resolved Issues
- Fixed issue on IPad where horizontal scrollbar was not working/interactive.
2.3.1
2018-05-09
Resolved Issues
- Implemented a fix for rare cases where foreign extensions were causing the Table to create duplicate rows.
2.3
2018-05-07
New Features
- Dynamically re-arrange column order in analysis mode.
Resolved Issues
- Fixed an issue where sorting would not work using Master Items. Multi-select would not de-select values - this was fixed.
- Null Cell Background color is now working again. Improved horizontal scroll repositioning after selections.
2.2
2018-04-30
New Features
- Horizontal scroll position is now preserved when selecting values, reordering columns or resizing the column widths.
2.1
2018-04-16
New Features
- Interactive column resizing now available.
Resolved Issues
- Total row would shrink down in pinned columns in Qlik Sense Desktop. Horizontal scrollbars would not appear in Qlik Sense Desktop & iOS App.
2.0.1
2018-04-11
Resolved Issues
- Bulletchart measure type loses its width when show data values option is enabled. Column Pin positioning was not visible in the property panel for old versions of the table.
2.0.0
2018-04-09
New Features
- Separate Dimensions & Measures have been removed - we now only have the concept of columns which can be used interchangeably as measures or dimensions permitting you the rearrange the order of columns as you like.
- You now have the ability to manually pin dimension/metrics to the right or left in the edit menu.
1.9.3
2018-04-06
Resolved Issues
- Fixed issues with show/hide measure&dimension.
1.9.2
2018-04-05
Resolved Issues
- Revert back the ability to add up to 100 dimensions & measures.
1.9.1
2018-04-03
Resolved Issues
- When hiding the header row the alignment of inner cells was incorrectly calculated.
1.9
2018-03-29
New Features
- New Pinning Feature: Use the ability to either pre-set or interactively pin columns of interest while you are scrolling horizontally to freeze panes. The feature applies both to dimensions, multiple dimensions, as well as to metrics. Dimensions are generally pinned to the left whereas metrics are pinned to the right.
- New Scroll Bar Design.
- New Shadow design for vertical scrolling.
Resolved Issues
- Compatability improvements with old Qlik Sense versions.
- Fixed issue where scrollbar was overlapping last column values in some versions of Google Chrome.
1.8.2
2018-03-13
New Features
- Improvement of the Search Functionality & Feb 18' compatibility.
Resolved Issues
- Updated Alternate States Manager to support QS Server.
1.8.1
2018-02-28
New Features
- Full Cell Text is now displayed on hover.
- You can now specify the name of the exported file. Increased number of dimensions to 100.
Resolved Issues
- Safari & iOS QS App compatibility.
1.8
2018-02-16
New Features
- Ability to define custom labels for drill-down dimensions. Vizlib Table now supports alternate states.
- Support of the Vizlib Table in Story Mode.
Resolved Issues
- Fixed sorting & search issues occurring in QS Feb 18. Header Tooltip would persist when the table got removed.
1.7.3
2018-01-22
New Features
- Compatability with QS Feb 18.
- Ability to set a responsive table min-width in case columns are narrow.
1.7.2
2018-01-15
New Features
- Vizlib Table now supports up to 100 measures (before we had a limit of 50).
- Ability to change the background and text color of individual headers, supported both for dimensions and measures.
- Ability to add a custom tooltip when hovering over the header. Particularly useful if you want to add some explanation or additional information on the metric/dimension. Supports HTML.
- Improved performance of very wide Vizlib Tables using horizontal virtualization. Vertical Scroll is now always visible, even with horizontal scroll.
Resolved Issues
- Improved the drag selection of multiple dimension values.
- Bug fixed when using the Vizlib Table as a Master Key Item in Story mode. Wrapping of Header Cells has been fixed.
- Sorting Arrows was sometimes misaligned.
- Fixed data values in Bullet Chart to be inline with the cell. CSS styling issues with the header and body size.
1.7.1
2017-12-28
New Features
- Ability to set the row height by either specifying it or by letting it calculate automatically.
Resolved Issues
- Removed unintentional top & bottom padding within cells.
1.7
2017-12-22
New Features
- Significant performance improvements.
- Data Points on Mini Line Chart are now supported including custom coloring based on intervals. Load more data button has been replaced with a more user-friendly endless scrolling functionality.
Resolved Issues
- Right-padding in cells would sometimes disappear in mashups. This has been rectified.
1.6.1
2017-12-17
New Features
- Number formatting of mini-chart tooltip now inherits the measure format. New calculation methods for column totals: Avg, Count, Min, Max, Sum. New Relative split options: Convert column metric values relative % to total.
- New Advanced Custom CSS Styling options for cell formatting (experimental). Progress Bars are now also supporting negative bars as an option.
- New Mini-Chart type: Bullet Chart.
- Auto-Fill option now distributes the available width evenly between available columns. This is useful to make the Vizlib Table responsive to different screen resolutions.
- Compatability with QS November 2017.
Resolved Issues
- Font Colors of Total row was not working and has been fixed.
- Conditional expressions in the column width would not work. This has been fixed.
1.6.0
2017-12-01
Resolved Issues
- Fixed some compatibility issues with IE11.
1.5.3
2017-11-16
New Features
- Ability to position the "Show more Data" button on the left/ centre/right.
Resolved Issues
- When loading two apps into a mashup, the Vizlib Table Search functionality would conflict. This is still occurring in Qlik Sense June 2017 Initial Release due to a reported API bug.
1.5.2
2017-11-02
New Features
- Enhanced HTML compatibility with custom HTML directives and attributes to facilitate 3rd party components integration inside the table.
1.5.1
2017-10-18
New Features
- Fix introduced for WebSocket communication error when extension is embedded in mashups sitting outside of Qlik Sense hostname.
Resolved Issues
- Fix introduced for WebSocket communication error when extension is embedded in mashups sitting outside of Qlik Sense hostname.
1.5
2017-09-06
New Features
- Search functionality has been added.
- Indicators can now be driven by a dynamic expression.
- Ability to format the font color of Totals, and to set the color of cell borders.
Resolved Issues
- Totals, when positioned at the bottom, would sometimes misalign - this has been fixed.
- Fixed an issue where promises would not work in IE11 when the extension was used on a mash-up sitting outside of Qlik Sense.
1.4.2
2017-08-10
Resolved Issues
- Exploring on a virtual proxy is fixed.
- Sometime Export dialogue would not appear, after second use.
1.4.1
2017-08-06
Resolved Issues
- Show all data sometimes freezing browser. Show/Hide measure misplaced column.
- Table would not re-render on removal and re-addition of a new dimension. CSS clashes with Leonardo UI.
1.4
2017-07-31
New Features
- Updated .qvf Demo example app shipped with the extension.
- In-cell HTML support - customize your expressions or metrics using HTML tags. HTML tag support for Headers.
- New measure representation: Indicators.
- New cosmetic feature: fill the last column with the rest of the table width.
Resolved Issues
- Fixed misalignment of "Load more data" button.
- Fixed breaking of columns when pagination was active Performance enhancements for Sparklines.
- Show all data feature has been recovered.
1.3.3
2017-06-19
Resolved Issues
- Fixed Bug where setting the color of the progress bar would sometimes freeze the property panel.
1.3.2
2017-06-15
New Features
- New Feature: Conditional Color Formatting of the progress bars. Support of the Vizlib Table for Master Key Items.
- Support of the Vizlib Table in Story Mode.
Resolved Issues
- Bug-fix for incorrect conditional background color in rows.
- Bug-fix for Exporting Table Data to XLS.
1.3.1
2017-05-21
New Features
- Full Support for Internet Explorer 11 & FireFox.
- Added a new Vizlib Table Demo app (.qvf) with lots of examples. Dynamic Labels are now maintained in the XLS/CSV Export.
Resolved Issues
- Fixed Bug where the color row highlighting would conflict if there were more than two tables on the sheet.
1.3
2017-04-23
New Features
- New .qvf Demo example shipped with the extension. Added Export to XLS/CSV/TSV on right-click.
- Adjustable Column Widths. Support for QS v3.2.3.
Resolved Issues
- Bar Chart is overlaying remaining columns. Column is lost when a measure is being hidden. Show total does not work by default.
- Support for QS v3.2.3.
- Converting to Vizlib Table was losing default values.
1.2
2017-04-18
New Features
- Copy Cell content on right-click.
- Measure can now be displayed as an URL. Drag selecting multiple cells.
- Support for Internet Explorer.
Resolved Issues
- Several Bug fixes & optimizations.
1.1.0
2017-04-10
New Features
- First release.
- Initial extension release. Dynamic Labels.
- Sparklines.
- Conditional Show/Hide of Measures. Rich formatting options.