Switch Overview

Use Vizlib Switch to apply more customization and control of your data variables. Vizlib Switch lets you turn measures, dimensions, or colors, on and off and switch between charts in your container grid.
Note: All data variables are set in Qlik. Please see the Qlik help pages; search for the keywords "working with variables" to learn more.
You can use Vizlib Switch to change any variable defined in a Qlik expression. Examples include:
-
Toggling Dimensions
-
Defining Measures
-
Changing Charts (see Vizlib Containers)
-
Changing Dashboard Views
-
Updating KPI sets
-
Updating themes or accessibility settings (Vizlib Sheet menu custom CSS).
Vizlib Switch is part of the Vizlib Library product suite, you can find out more about Library by watching our product demonstration. You can also download the product catalog here.
We've organized our documents into several categories, and to make them easy to find, we've included keywords in the document title.
This topic contains the following sections:
Introduction
This page helps you get started with Vizlib Switch and explains where to find the information you need.
If you're new to our products, why not watch our video on getting started with Vizlib here?
You can find the latest version of Vizlib Switch from our User Portal in the Library section of the Downloads page. The software includes an installation file and a demo app showing you how Vizlib Switch works, and you can visit our Demo Apps Gallery to search for examples to get you started.
Guides
Guides are articles that contain technical information relating to Vizlib Switch.
Vizlib products all have the same installation process, and there are installation guides for Qlik Sense server and desktop.Vizlib Switch uses templates, so you can finish your design in a few clicks, and save it to re-use in the future. You can find out more about working with templates in our article here.
Properties
Properties articles contain information on the Property Panel, which you use in the Qlik Sense Hub to manage functions for Vizlib Switch. These articles cover subjects like Templates, Switch Items, Appearance and Interactivity.
Best Practice and Troubleshooting
You can use our Best Practice and Troubleshooting article to help you get started with Vizlib Switch. You can read more here.
Changelog
The Changelog contains details for each release of Vizlib Switch, such as new features and bug fixes. You can find the changelog here, and you can sign up to receive notifications of new releases for all Vizlib products here.
Examples
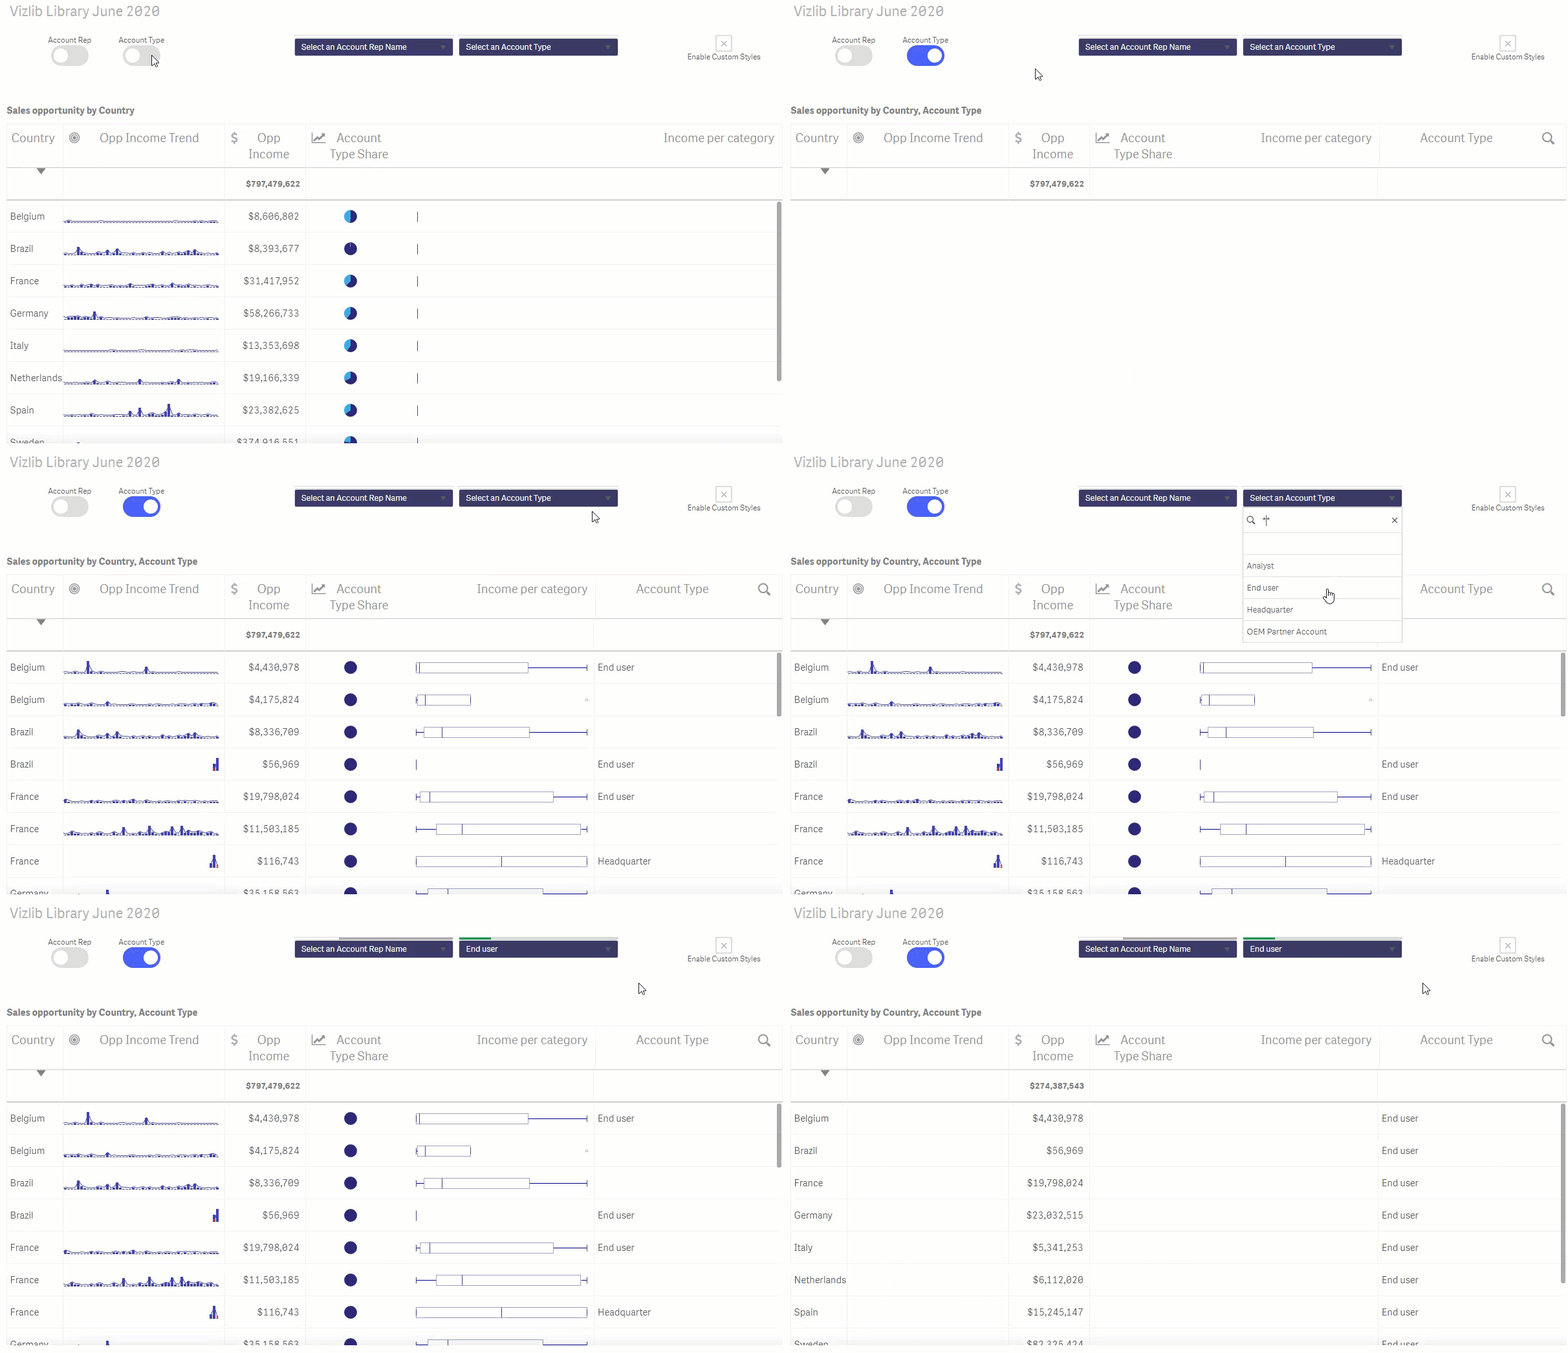
You can see how the switch works in Figure 1. The switch is enabled and changes color, displaying a new column Account Type in the table. This column can then be used as a filter to display rows that match the selected value.

Figure 1: Vizlib Switch
Related Articles: