Heatmap Overview

Vizlib Heatmap is a highly customizable, supported and easy-to-use extension for Qlik Sense which provides a graphical representation of your data. Individual values are contained in a matrix and highlighted as colors based on your measure, a feature which is not available in the native Qlik Sense Chart Library.
Vizlib Heatmap features include:
-
Fully customizable Heatmap with rich formatting options.
-
Legend Control including flexible positioning (bottom/top/left/right/radial, left/right alignment, legend scale, labels).
-
Supports multiple measures to populate the Powerful tooltip - add more metrics and KPIs and display them on hover.
-
Choose from a wide range of color palettes or set your own colors for your Heatmap.
-
Reference lines - Add X and Y axis dimension lines to help display targets or thresholds.
-
Full control over interactivity and ability to turn native functionality off (i.e: full screen).
Vizlib Heatmap is part of the Vizlib Library product suite, you can find out more about Library by watching our product demonstration. You can also download the product catalogue here.
We've organized our documents into several categories, and to make them easy to find, we've included keywords in the document title.
This topic contains the following sections:
Introduction
This page helps you get started with Vizlib Heatmap and explains where to find the information you need.
If you're new to our products, why not watch our video on getting started with Vizlib here?
You can find the latest version of Vizlib Heatmap on our User Portal in the Library section of the Downloads page. The software includes an installation file and a demo app showing you how Vizlib Heatmap works, and you can visit our Demo Apps Gallery where you can search for examples to get your started.
Guides
Guides are articles which contain technical information relating to Vizlib Heatmap.
Vizlib products all have the same installation process, and there are installation guides for Qlik Sense server and desktop. You can also find a setup guide here.
Properties
Properties articles contain information on the Property Panel, which you use in the Qlik Sense Hub to manage functions for Vizlib Heatmap. These articles cover subjects like Data, Sorting and Data Handling, Reference Lines, Appearance and Interactivity and Alternate States.
Best Practice and Troubleshooting
You can use our Best Practice and Troubleshooting articles to help you get started with Vizlib Heatmap. We've compiled a best practice guide which also contains known issues here.
Changelog
The Changelog contains details for each release of Vizlib Heatmap, such as new features and bug fixes. You can find the changelog here, and you can sign up to receive notifications of new releases for all Vizlib products here.
Examples
Figure 1 shows selections being made within Vizlib Heatmap for product sales figures, Figure 2 shows a sales League Table, Figure 3 displays data on infectious diseases and Figure 4 shows a regional breakdown of customer numbers.
Figure 1: Heatmap Example
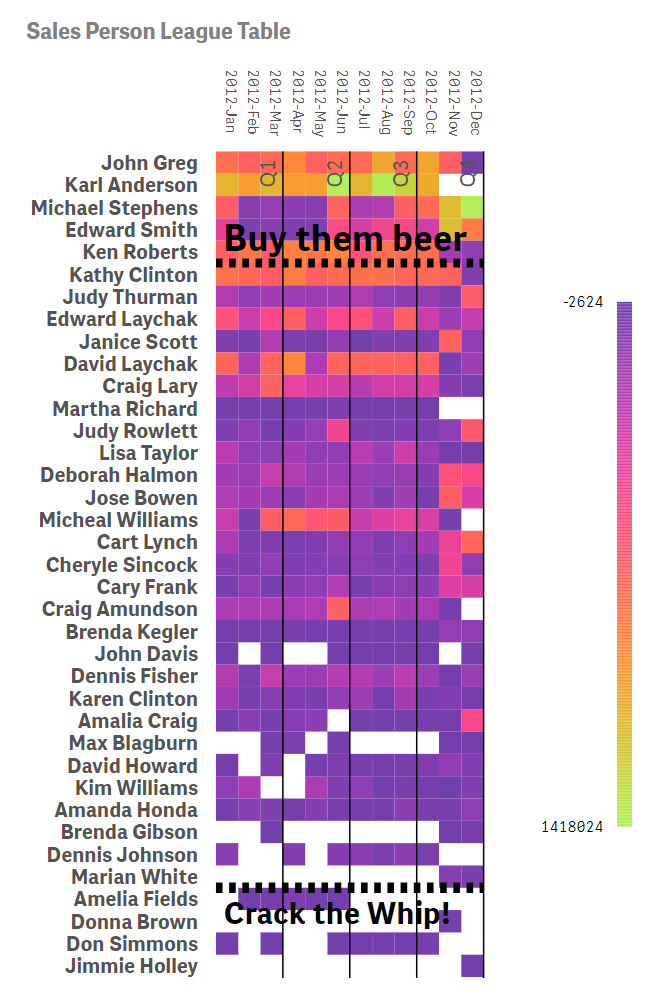
Figure 2: League Table
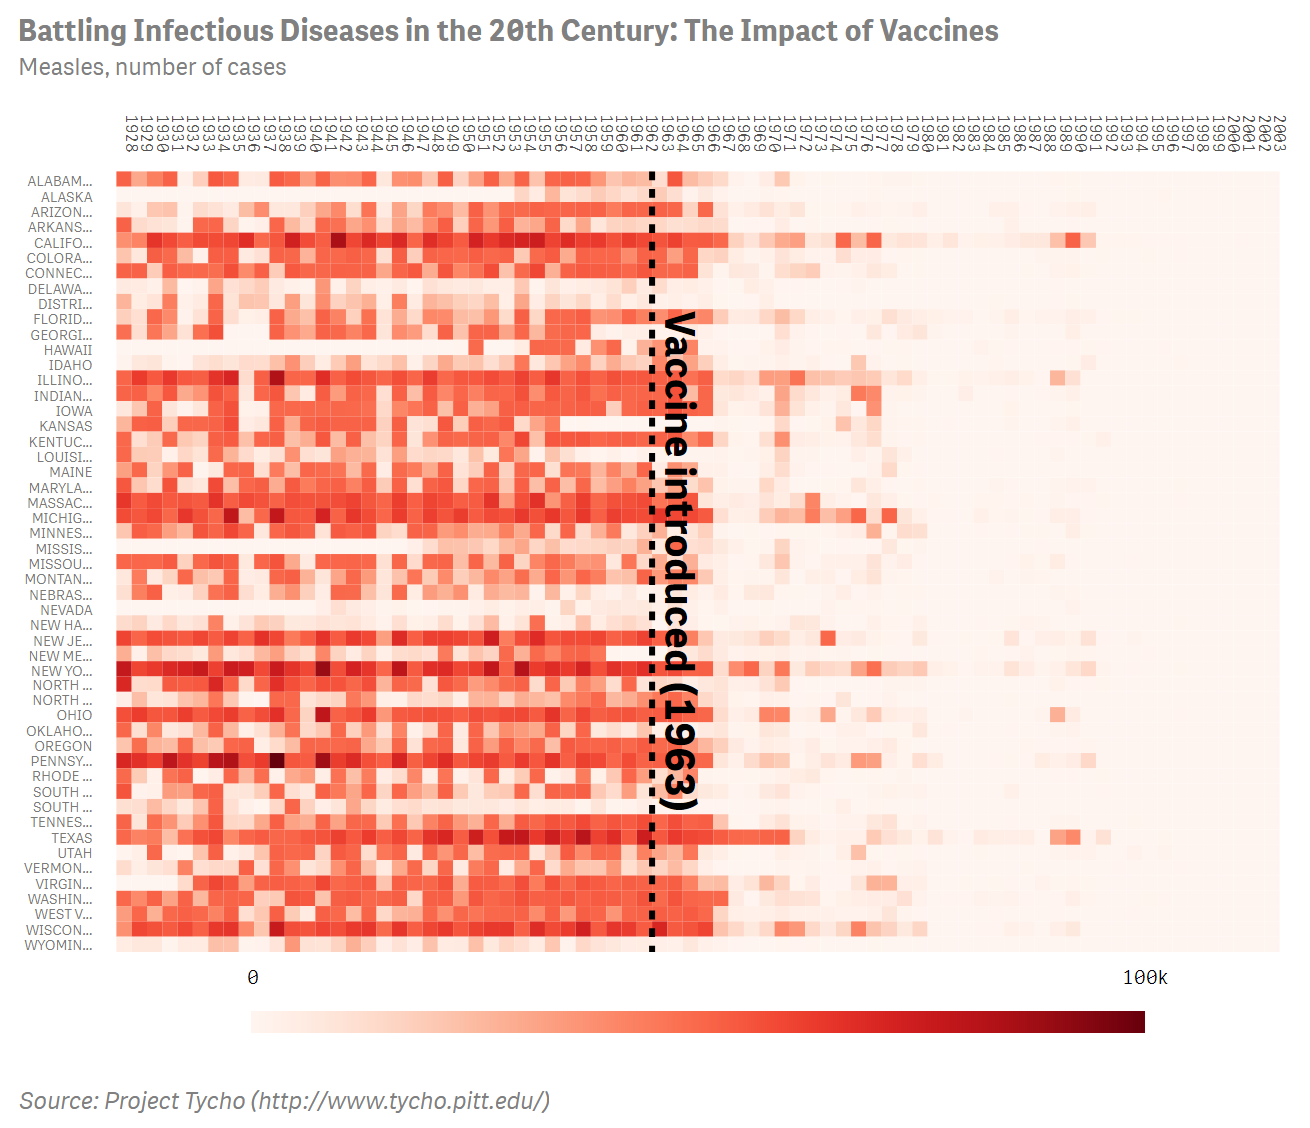
Figure 3: Infectious Diseases
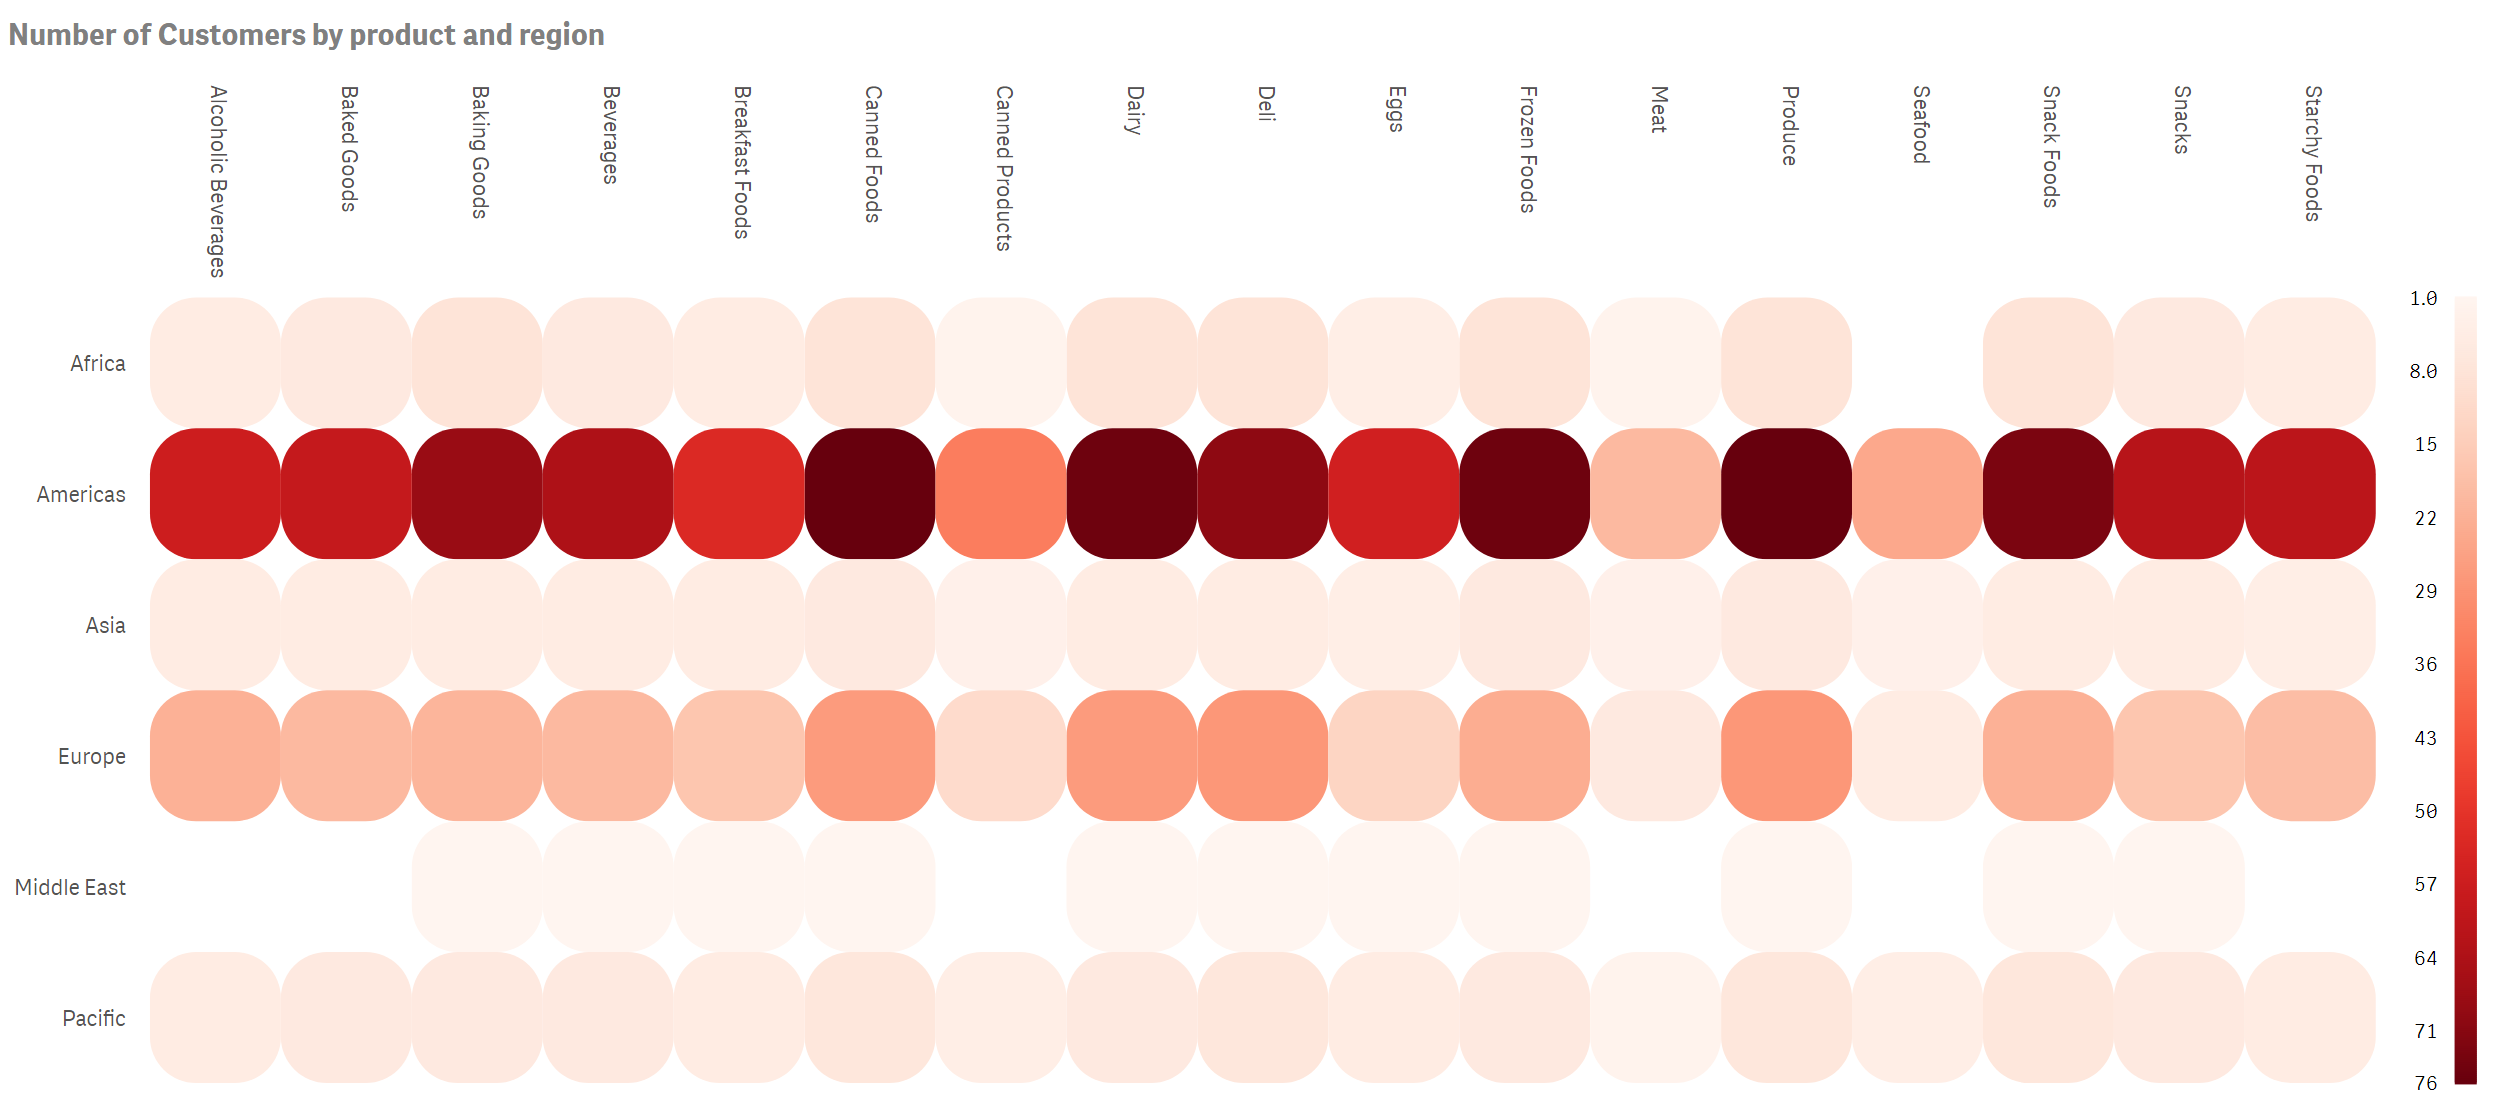
Figure 4: Customer
Related Articles: