Applying Layer settings
Layer settings are used to add and customize data visualizations within the KPI object. They help you control and modify objects individually as you lay them out in the KPI Designer. KPI Designer’s lightweight versions of popular Vizlib extensions help you create dashboards that load quickly but deliver the depth of information you need to convey.
This topic contains the following sections:
Layer Properties
You can add, clone, copy and remove the layers you create.
From the properties panel, click Layers to start. The layer options display at the top of the Layers section heading (Figure 1).
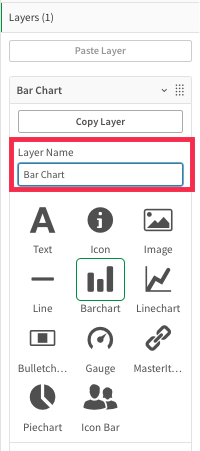
Figure 1: Create and name your layers
Good Practice with Layers
We do not recommend adding more than ten layers to a KPI object, as this can cause issues with performance. You can find more tips on working with KPI Designer in its Best Practice article.
Adding more than one master item in a KPI layer, you'll find performance could be affected. It's better to have one KPI object and multiple layers within it, though we also don't recommend using more than ten layers per object.
The Qlik Sense hub engine is better at processing layers than objects, which is another reason for having multiple layers in a single object.
Adding a Layer
-
From the properties panel, click Layers.
-
Click Add Layer.
-
Select a Layer type.
-
Enter a descriptive Layer Name that identifies the Layer quickly.
-
The number of layers in the object is shown in brackets beside the Layer section header. In Figure 2, the example shows nine layers - Layers (9).
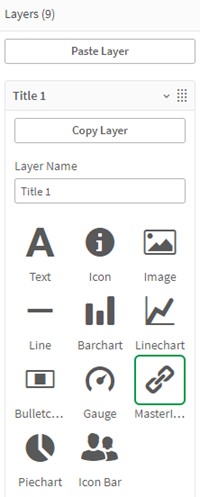
Figure 2: Layer types
Layer Types
Vizlib KPI Designer supports the following layer types to choose from. Each layer type has distinct properties, which you can read about by clicking the layer name and shared settings.
| Image | |||
| Bullet Chart | Gauge Chart | ||
| Icon Bar |
Using the Read-only Option with a Master Item
Keeping your dashboard light so it can load quickly is KPI Designer’s key strength; however, there may be times when you want to allow more interaction with a specific object on your dashboard.
The option to Read only with a Master item allows interaction with the Master item(s) you select. This provides a focused area where your user can explore the data more in-depth - but you still keep the benefits of using KPI designer. You can enable the following:
-
Scrolling within a table.
-
Hover over a line chart to display the tool/Viztips.
-
updates for all the other Master items when you interact with that Master item.
To use the Read-only property (Figure 2):
-
Click Add Layer.
-
Select Master Item.
-
Scroll down to view the Read-only option, and click in the box to select it.
Note: You can interact with it on the KPI but cannot (as of yet) do it with a Viztip.
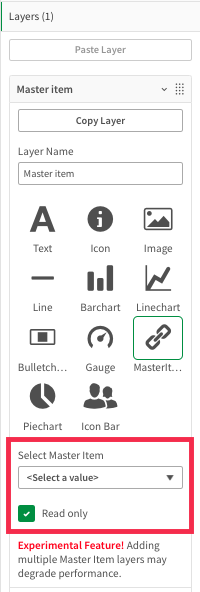
Figure 2: Read-only
Background
For each layer, you can choose a Background Color, set the Background Color Opacity, and set the Padding Width (Figure 3).
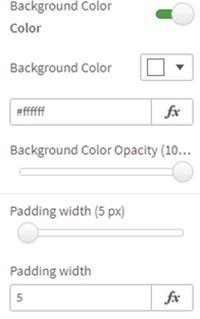
Figure 3: Background
Border
You can enable a Layer Border (Figure 4), and choose the layout with the Border Selector, choose a Border Style, a Layer Border Color, and set the Layer Border Width and Layer Border Radius.
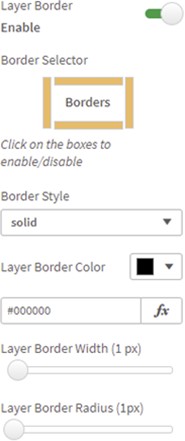
Figure 4: Border
Tooltip
If you Enable Tooltip (Figure 5), you'll be able to enter some Tooltip Text, choose a Font Color, Font Size, Font Style and Font Family.
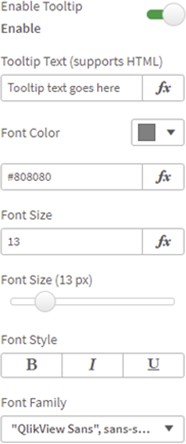
Figure 5: Tooltip
Background Color (Figure 6), control the Opacity with the slider, choose a Tooltip Position, and enable Tooltip Fits Window to stop the text being cut off when it's opened at the edge of the sheet.
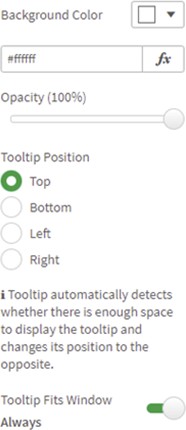
Figure 6: Tooltip
Vizlib Actions
Vizlib Actions (Figure 7) allow you to apply an action after clicking on the KPI Object. If you click Add Action, you'll open the action settings. Then choose the action you want from Pick Action. You can find out about how to work with Vizlib Actions here.
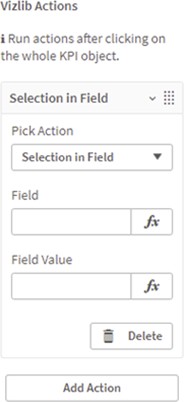
Figure 7: Vizlib Actions
Position, Visibility
You can use the Position controls (Figure 8) to set the position (X and Y coordinates), Width, and Height. You can also enter a Visibility condition to show or hide the layer.
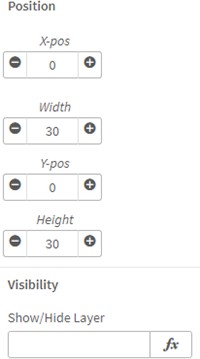
Figure 8: Position, Visibility